Use the purple points (diamond symbol) to plot the social cost curve when the external cost is $450 per ton. Socl Cost Phate Co OOemand ve Ve QUANTITY (fons of papen The market equilibrium quantity is tons of paper, but the socially optimal quantity of paper production is tons. To create an incentive for the firm to produce the socially optimal quantity of paper, the government could impose a of per ton of paper. (edede d uop
Use the purple points (diamond symbol) to plot the social cost curve when the external cost is $450 per ton. Socl Cost Phate Co OOemand ve Ve QUANTITY (fons of papen The market equilibrium quantity is tons of paper, but the socially optimal quantity of paper production is tons. To create an incentive for the firm to produce the socially optimal quantity of paper, the government could impose a of per ton of paper. (edede d uop

Essentials of Economics (MindTap Course List)
8th Edition
ISBN:9781337091992
Author:N. Gregory Mankiw
Publisher:N. Gregory Mankiw
Chapter10: Externalities
Section: Chapter Questions
Problem 2PA

Related questions
Question
On graph
Price 150,300,450 , 600,.................1500
Quantity 0,1,2,3,4,5...
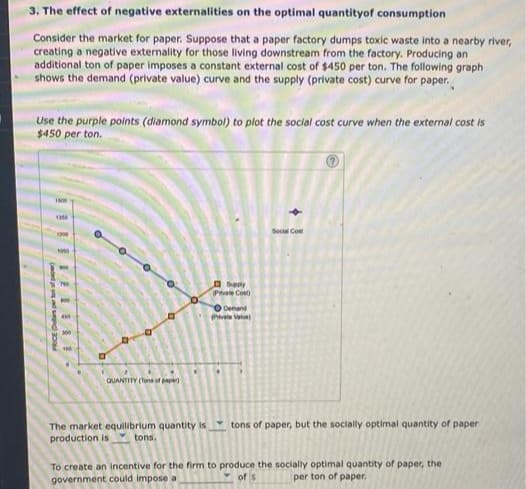
Transcribed Image Text:3. The effect of negative externalities on the optimal quantityof consumption
Consider the market for paper. Suppose that a paper factory dumps toxic waste into a nearby river,
creating a negative externality for those living downstream from the factory. Producing an
additional ton of paper imposes a constant external cost of $450 per ton. The following graph
shows the demand (private value) curve and the supply (private cost) curve for paper.
Use the purple points (diamond symbol) to plot the social cost curve when the external cost is
$450 per ton.
Socl Cost
a seny
Pate Co
O Oemand
vale V
QUANTITY (fons of papen
tons of paper, but the socially optimal quantity of paper
The market equilibrium quantity is
tons.
production is
To create an incentive for the firm to produce the socially optimal quantity of paper, the
government could impose a
of
per ton of paper.
(ededed d
Expert Solution
This question has been solved!
Explore an expertly crafted, step-by-step solution for a thorough understanding of key concepts.

This is a popular solution!

Trending now
This is a popular solution!

Step by step
Solved in 2 steps with 1 images

Recommended textbooks for you
Essentials of Economics (MindTap Course List)
Economics
ISBN:
9781337091992
Author:
N. Gregory Mankiw
Publisher:
Cengage Learning


Principles of Economics 2e
Economics
ISBN:
9781947172364
Author:
Steven A. Greenlaw; David Shapiro
Publisher:
OpenStax
Essentials of Economics (MindTap Course List)
Economics
ISBN:
9781337091992
Author:
N. Gregory Mankiw
Publisher:
Cengage Learning
Principles of Economics 2e
Economics
ISBN:
9781947172364
Author:
Steven A. Greenlaw; David Shapiro
Publisher:
OpenStax

Principles of Microeconomics
Economics
ISBN:
9781305156050
Author:
N. Gregory Mankiw
Publisher:
Cengage Learning

Principles of Economics, 7th Edition (MindTap Cou…
Economics
ISBN:
9781285165875
Author:
N. Gregory Mankiw
Publisher:
Cengage Learning

Principles of Economics (MindTap Course List)
Economics
ISBN:
9781305585126
Author:
N. Gregory Mankiw
Publisher:
Cengage Learning