$50 Supply $40 B $30 E $20 Price $10 Ceiling Demand $0 40 80 120 160 200 Quantity 
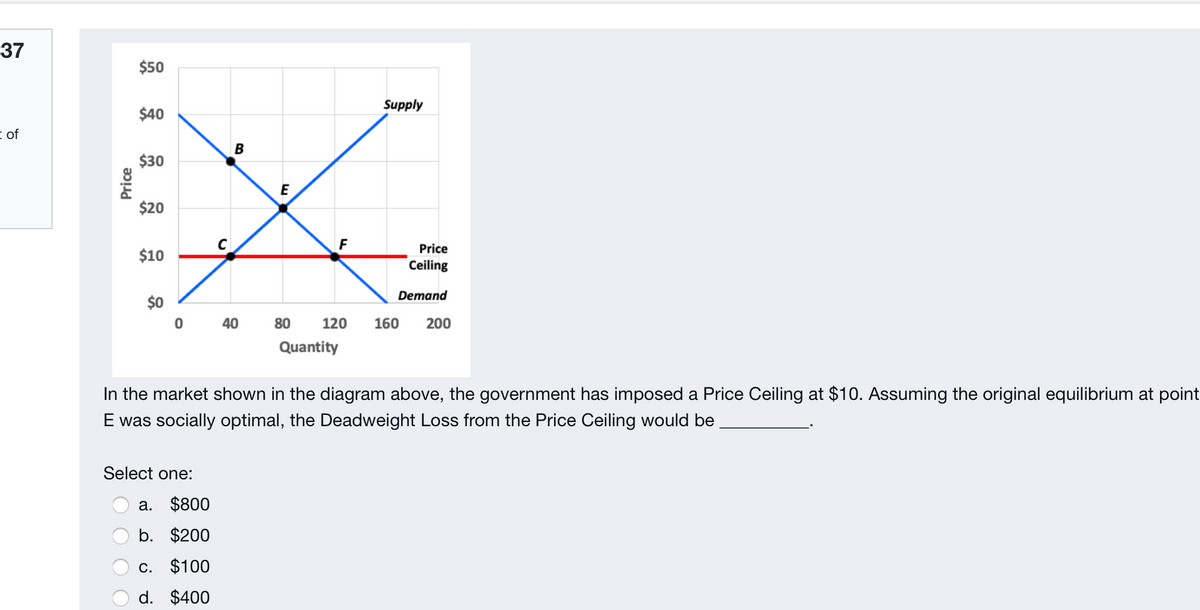
In the market shown in the diagram above, the government has imposed a Price Ceiling at $10. Assuming the original equilibrium at poir E was socially optimal, the Deadweight Loss from the Price Ceiling would be Select one: a. $800 b. $200 c. $100 d. $400 Price
Q: The graph shows the market for luxury boats before and after the 20 percent tax is put on luxury…
A: Since you have specifically asked we are providing only the solution for last two parts of the…
Q: formation (which is ldentical to the scendrio in the video), 10,000-2P 500+5P ernal Benefit: MEB =…
A: *Answer:
Q: Price (dollars per pound) 6.00- 5.00- 4.00- 3.00- 2.00- 1.00- 0.00- 8. 12 16 20 Quantity (billions…
A: Since we only answer up to 3 sub-parts, we’ll answer the first 3. Please resubmit the question and…
Q: 10. Toasters last time! With the same data as the last problem. What happens if govermment imposes a…
A: “Since you have posted a question with multiple sub-parts, we will solve first three sub-parts for…
Q: $4.00 $2.50 D $0.50 200 Quantity (Q) The market shown in the figure above is in equilibrium at the…
A: Equilibrium is achieved at the output level where Qs equals Qd. Thus Q*= 200 units P*= $ 2.50
Q: 1. On the graph below, show a price ceilling at $3. a. Illustrate and identify the resulting XS…
A: "As per the guidelines answer is given to the first question" 1) "Price ceiling is a limit on price…
Q: 10. Toasters last time! With the same data as the last problem. What happens if government imposes a…
A: The total surplus is the total welfare in the economy which is the sum of consumer and producer…
Q: Explain the factors affecting Demand.
A: "Since you have asked multiple questions, we will answer only first question for you. If you have…
Q: S1 S2 D2 F D1 E A Quantity Refer to the provided supply and demand graph. S, and D, represent the…
A: Given that S1 and D1 are the supply curve and demand curve respectively. S2 and D2 represents the…
Q: The graph show the marginal social benefit, demand, and supply curves in the milkshake market.…
A: Externalities are the costs and benefits that are derived from an economic transaction by a third…
Q: (Figure: Market 3) Use the graph to answer the question. Marginal social Price cost Supply $6 $5…
A: *Socially optimal output is the output where demand and social cost are equal.Therefore socially…
Q: Most countries today have subsidised the provision of education. We will use the UK as an example…
A: Subsidy is the money transfer of money from the State(government) to the individual/institution.…
Q: Answer the attached question
A: Externality is the negative or positive spillover by the consumer or producer which affects the…
Q:
A: To determine the deadweight loss at the market equilibrium quantity.
Q: olicymakers are provided data about the private and social benefits of a good being sold in the…
A: Private benefit is the benefit obtained from the consumption or production of a good by an…
Q: Price (dollars per tire) S+ tax 70 60 50 40 30 20 10 10 20 30 40 50 60 70 Quantity (millions of…
A: In the diagram we see that before the imposition of the tax, equilibrium price was $50 per tire.…
Q: What areas in the above graph represent the tax revenue from a Pigovian tax that internalizes the…
A: A Pigovian tax is a tax placed on any good which creates negative externality.
Q: Demand: Qd = 1200 - 3P %3D Supply 1: Q1 = -200 + 2P %3D Supply 2: Q2 = -600 + 2P KAK Panel A Panel…
A: Given that Qd = 1200 - 3P Qs1 = -200 + 2P Qs2 = -600 + 2P At equilibrium, Qd = Qs = 1200 - 3P = -200…
Q: Which of the following best describes where total surplus is maximized when an extemality exists in…
A: Marginal social benefit refers to the benefit to the society from consumption of additional units…
Q: Suppose that the shoe market begins in equilibrium, and that its supply and demand is given by: $12…
A: When the government distributes money to consumers or producers through a subsidy, it might be…
Q: 1. The equilibrium price of juice was initially $1.80 per bottle, and the equilibrium quantity was…
A: here we calculate the tax face by buyer , seller and affect of tax on consumption as follow-
Q: I need help woth all parts of number 5
A: a.The tax imposes on the tourists who reside in any one of the hotel rooms of the M economy. This…
Q: a) Identify the type of market failure illustrated by the graph. Explain. b) Using the numbers on…
A: Answers 1.The market failure here is an externality. It is a type of positive externality. It…
Q: Note the equations, taxes and use all the equations and numbers as given in the question. The market…
A: The demand and supply equations: Equate the two equations to obtain the equilibrium quantity and…
Q: PART I: Below is the quantity demanded and supplied in the market for skis. What is the equilibrium…
A:
Q: Sophie pays Sky $50 to mow her lawn every week.When the government levies a mowing tax of $10 onSky,…
A: Consumer surplus (CS) is the difference between consumer’s willingness to pay and equilibrium price.…
Q: D B Price ceiling D Q Q2 Q1 The figure above shows a market for gasoline with a price ceiling equal…
A: Demand is the willingness and ability of consumers for consuming and buying goods and services at…
Q: Suppose the market supply and demand for guitars in Happy Valley are given by: Supply: Q=-60+3P…
A: Given QS=-60+3P QD = 540 - 5P
Q: Figure 10-1 (above)- For the described negative externality, what is the market Price/Quantity…
A: Negative externalities are negative side effects of economic activities which are faced by the third…
Q: Price (dollars per tire) S + tax 70 60 50 40 D. 30 20 10 10 20 30 40 50 60 70 Quantity (millions of…
A: Initially D is the demand curve and S is the supply curve for tires. Equilibrium is achieved at the…
Q: 16 The market demand for good x is y(d)-a-2bp, and the market supply is y(s)-ep, the government…
A:
Q: New line D Quantity Suppose that the production of paper results in waste material being dumped into…
A: Externality refers to spill-over effect of production or consumption of the good on the third party…
Q: Price (dollars per gallon) Supply, S, Тax $3.80 3.40 3.20 Demand 30 35 Quantity (billions of gallons…
A: “Since you have asked multiple question, we will solve the first question for you. If you want any…
Q: Four roommates a rc planning to sp<,nd the weekendin their dorm room watching old movies, and…
A: "Since you have posted a question with multiple subparts, we will solve the first three subparts for…
Q: Greater consumption of alcohol leads to more motorvehicle accidents and, thus, imposes costs on…
A: a) The greater consumption of alcohol leads to accidents, so it presents the negative externality as…
Q: 5.00 4.50 S- MSC 4.00 3.50 3.00 2.50 2.00 1.50 1.00 D- MSB 0.50 100 200 300 400 500 Quantity…
A: The efficient level of good is where its demand equals its supply. Thus, when the productivity of…
Q: The diagram to the right shows a market in which a price floor has been imposed. Identify the…
A: Price floor is the minimum price imposed for a commodity. If price floor is above the equilibrium…
Q: If Sam is willing to pay $50 for one good X, $30 for a second, $20 for a third, $8 for a fourth, and…
A: To determine the consumer surplus of person S.
Q: Suppose you overheard a conversation in which an economist referred to the "free-rider problem." It…
A: Public goods are those goods which are neither excludable not rivalrous in nature.
Q: Price $10 $9 $8 S $7 $6 $5 $4 $3 $2 $1 D 100 200 300 400 500 Suppose the government imposes a $3 per…
A: Equilibrium is achieved where quantity demanded by consumer equals quantity supplied by producer at…
Q: A small town provides a fireworks display. which is a public good, every fourth of July. For…
A: Demand refers the total amount of goods and services that are willing and able to buy at the…
Q: Demand 100 200 300 400 500 a. How many units of good are produced at the market equilibrium? b. How…
A: Private costs are paid by the firm or consumer and must be included in production and consumption…
Q: e government restricts the use of a polluting good to q, by imposing a price ceiling p.. Three…
A: A price ceiling is a government-imposed limit on how much a seller can charge for a product or…
Q: A local government is considering introducing a tax on Which good hould they tax if they want to…
A: Deadweight loss occurs due to inefficient quantity produced. Elasticity helps in determining which…
Q: Price 30 MC 23 20 15 ATC D 9 12 Quantity MR c) If this firm is operated as a competitive market,…
A: In a perfectly competitive market firms operate at an output level where Marginal Cost is equal to…
Q: Price (P) S2 (after tax) S, (before tax) Тах $35 $30 $25 $20 D 90 100 Quantity (Q) The diagram above…
A: Deadweightloss represents inefficiency of market. It disrupts the market equilibrium where quantity…
Q: Some economists claim that early child care generates an external benefit to society. a. What is the…
A: A positive externality refers to a benefit received by a third party from an economic transaction in…
Q: Illustrate the deadweight loss that occurs when an activity-- say, the city of Long Beach…
A:
Trending now
This is a popular solution!
Step by step
Solved in 2 steps
- Show the market for cigarettes in equilibrium, assuming that there are no laws banning smoking in public. Label the equilibrium private market price and quantity as Pm and Qm. Add whatever is needed to the model to show the impact of the negative externality from second-hand smoking. (Hint: In this case it is the consumers, not the sellers, who are creating the negative externality.) Label the social optimal output and price as Fe and Qe. On the graph, shade in the deadweight loss at the market output.Draw a standard supply and demand diagram for televisions, and indicate the equilibrium price and output. a. Assuming that the production of televisions generates external costs, illustrate the effect of the producers being forced to pay a tax equal to the external costs generated, and indicate the equilibrium output. b. If instead of generating external costs, television production generates external benefits, illustrate the effect of the producers being given a subsidy equal to the external benefits generated, and indicate the equilibrium output.Greater consumption of alcohol leads to more motorvehicle accidents and, thus, imposes costs on peoplewho do not drink and drive.a. Illustrate the market for alcohol, labeling thedemand curve, the social-value curve, thesupply curve, the social-cost curve, the marketequilibrium level of output, and the efficient levelof output.b. On your graph, shade the area corresponding tothe deadweight loss of the market equilibrium.(Hint: The deadweight loss occurs because someunits of alcohol are consumed for which the socialcost exceeds the social value.) Explain.
- Some economists claim that early child care generates an external benefit to society. a. What is the market equilibrium? What is the socially optimal outcome? How do they differ? b. The government is planning to provide a per-unit subsidy for child care to achieve the socially optimal outcome. How large should this subsidy be? c. How much is the total government subsidy each month to reach a socially optimal outcome?Please answer the following questions.1. Explain the factors affecting Demand.2. Explain the difference between positive and negative externalities alongwith an example.3. How are public goods different from private goods?4. Explain the Law of Supply.5. With regard to demand and Supply, explain the point of MarketEquilibrium.Your grandmother likes old-fashioned yard salesand doesn’t understand why everyone is so excitedabout eBay. Explain to her why the creation of amarket that enables people who don’t live in thesame town to buy and sell used goods increasestotal surplus over the yard-sale market.
- B. Let’s consider the market for flour in a different town. Assume that it is efficient (i.e. that there are not external costs to producing flour, and no external benefits from consuming it). Price ($/lb) Quantity Supplied (thousands of lbs per day) Quantity Demanded (thousands of lbs per day) 1.5 8 14 2 9 13 2.5 10 12 3 11 11 3.5 12 10 4 13 9 What is the price and quantity of flour sold without government intervention. Graph this equilibrium. XXXX 2. Suppose that, alarmed by the inability of many poorer consumers to buy flour, the government institutes a $2/lb price ceiling. How much flour will suppliers wish to sell, and how much will buyers demand? How much flour will actually be sold? Show this outcome on the same graph you drew for question 1. XXXX 3. Describe, in one sentence each, three problems that this policy might create? Please do not simply copy down phrases from the textbook, but instead describe ways that…Table 1Buyer Willingness To PayLori $50.00Audrey $30.00Zach $20.00Calvin $10.002. Refer to Table 1. If the price of the product is $15, then who would be willing to purchase theproduct?a. Lorib. Lori and Audreyc. Lori, Audrey, and Zachd. Lori, Audrey, Zach, and Calvin3. Refer to Table 1. If price of the product is $30, then the total consumer surplus isa. $-10.b. $-6.c. $20.d. $30.uppose that we are considering the market for windmills. The private demand for electric cars is given buy: Qd = 160 − 2? And the private supply of electric cars is given by: Qs = p − 20Suppose also that electrci cars produce a positive externality, with a Marginal Economic Benefit of $30 per unit. 5. What would be the private market equilibrium (p* & Q*)? 6. What is the socially optimal equilibrium (p* & Q*)? 7. What is Producer Surplus and Consumer Surplus in the private market equilibrium? 8. What is the increase in Total Surplus from moving from the private market equilibrium to the socially optimal equilibrium?
- What exactly is a Pigovian tax? Give some instances of how the Pigovian tax can be used to tackle environmental issues.Marginal Social Cost: P = 1 + 2 Q Graph the market. Be sure to fully and clearly label the graph, including: the Demand (D), the Marginal Private Cost (MPC), the Marginal Social Cost (MSC), the Private Equilibrium Quantity (Qpe), Private Equilibrium Price as (Ppe), the Socially Optimal Price (Ps), the Socially Optimal Quantity (Qs), and the Deadweight Loss (DWL).Suppose Scott and Bob live on the same street. in the winter, both of them like their street plowed. Bob's demand is given by 0 = 40 - P, and Scott's demand is gren by 0 = 30 - 2P. Suppose the marginal cost of plowing the snow is constant at $35 (a) What is the social marginal benefit curve? (b) What is the socially efficient amount of plowing? (c) What would be the socially efficient amount of plowing if the marginal cost of plowing were $5?