Use the results of your answers on both the Scenario 1 and Scenario 2 graphs to complete the following table. Begin by indicating the overall change in the equilibrium price and quantity after the shift in demand or supply for each shift-magnitude scenario. Then, in the final column, indicate the resulting change in the equilibrium price and quantity when supply and demand shift in the direction you previously indicated on both graphs. If you cannot determine the answer without knowing the magnitude of the shifts, choose Cannot determine. Change in Equilibrium Objects Equilibrium Object Scenario 1 Scenario 2 When Shift Magnitudes Are Unknown Price Quantity True or False: When both the demand and supply curves shift, the curve that shifts by the larger magnitude determines the effect on the undetermined equilibrium object. True False
Use the results of your answers on both the Scenario 1 and Scenario 2 graphs to complete the following table. Begin by indicating the overall change in the equilibrium price and quantity after the shift in demand or supply for each shift-magnitude scenario. Then, in the final column, indicate the resulting change in the equilibrium price and quantity when supply and demand shift in the direction you previously indicated on both graphs. If you cannot determine the answer without knowing the magnitude of the shifts, choose Cannot determine. Change in Equilibrium Objects Equilibrium Object Scenario 1 Scenario 2 When Shift Magnitudes Are Unknown Price Quantity True or False: When both the demand and supply curves shift, the curve that shifts by the larger magnitude determines the effect on the undetermined equilibrium object. True False

Chapter12: The Partial Equilibrium Competitive Model
Section: Chapter Questions
Problem 12.3P

Related questions
Question
I'm having trouble understanding how to complete this question. For the graphs, I don't understand what the difference is between the two scenarios that should be graphed. Based on the explanation, I felt the
Secondly, I'm not understanding how to transfer the information from the graphs to the table below. In particular, the third column has me confused. If you could help me understand the concept and how to solve those graphs, the table, and the T/F question at the bottom, that would be great! Thank you!
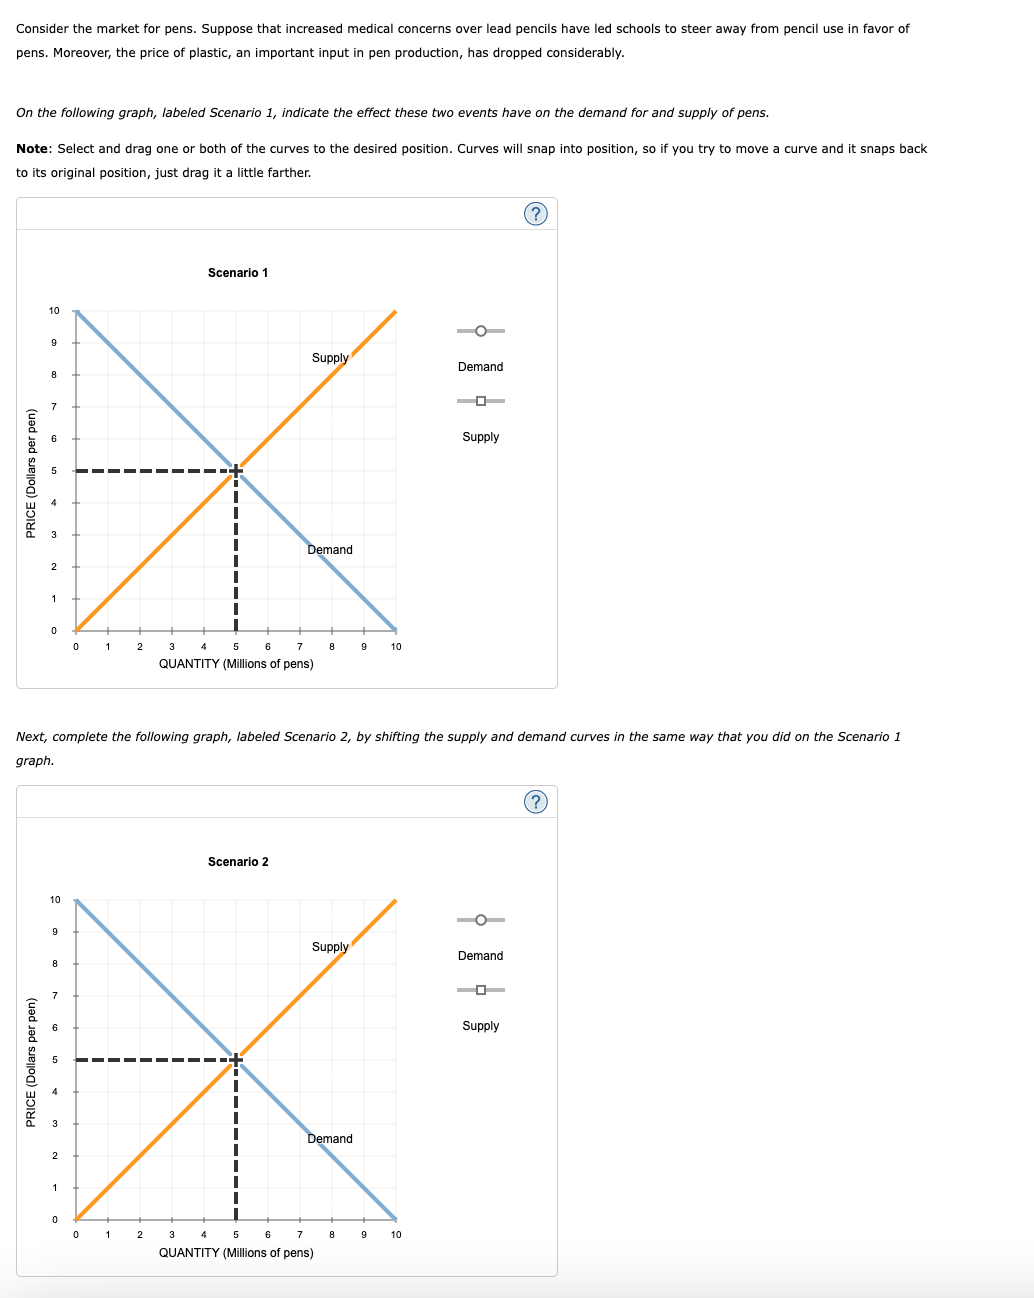
Transcribed Image Text:Consider the market for pens. Suppose that increased medical concerns over lead pencils have led schools to steer away from pencil use in favor of
pens. Moreover, the price of plastic, an important input in pen production, has dropped considerably.
On the following graph, labeled Scenario 1, indicate the effect these two events have on the demand for and supply of pens.
Note: Select and drag one or both of the curves to the desired position. Curves will snap into position, so if you try to move a curve and it snaps back
to its original position, just drag
a little farther.
Scenario 1
10
Supply
Demand
8
7
6
Supply
Demand
2
1
1
3
6
7
8
10
QUANTITY (Millions of pens)
Next, complete the following graph, labeled Scenario 2, by shifting the supply and demand curves in the same way that you did on the Scenario 1
graph.
(?)
Scenario 2
10
9
Supply
Demand
7
Supply
Demand
1
3
6
7
10
QUANTITY (Millions of pens)
PRICE (Dollars per pen)
PRICE (Dollars per pen)
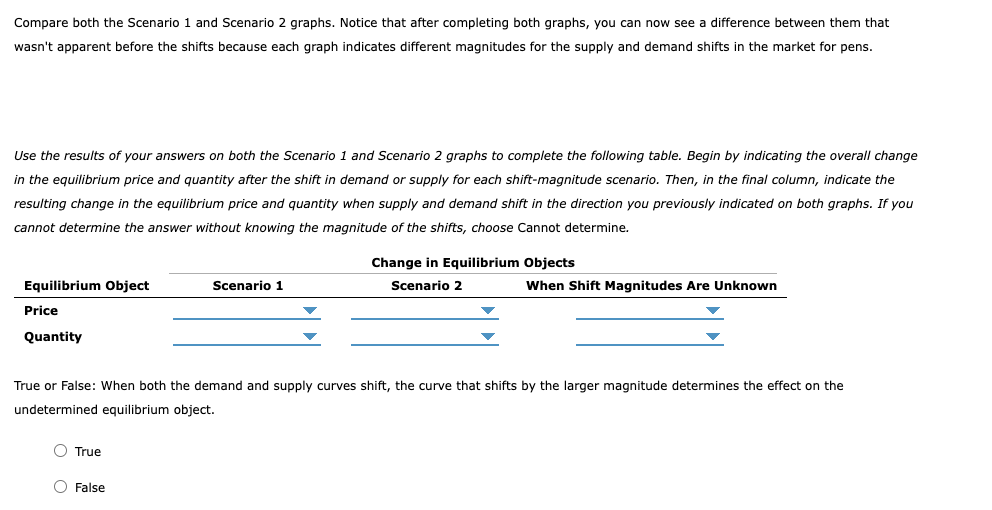
Transcribed Image Text:Compare both the Scenario 1 and Scenario 2 graphs. Notice that after completing both graphs, you can now see a difference between them that
wasn't apparent before the shifts because each graph indicates different magnitudes for the supply and demand shifts in the market for pens.
Use the results of your answers on both the Scenario 1 and Scenario 2 graphs to complete the following table. Begin by indicating the overall change
in the equilibrium price and quantity after the shift in demand or supply for each shift-magnitude scenario. Then, in the final column, indicate the
resulting change in the equilibrium price and quantity when supply and demand shift in the direction you previously indicated on both graphs. If you
cannot determine the answer without knowing the magnitude of the shifts, choose Cannot determine.
Change in Equilibrium Objects
Equilibrium Object
Scenario 1
Scenario 2
When Shift Magnitudes Are Unknown
Price
Quantity
True or False: When both the demand and supply curves shift, the curve that shifts by the larger magnitude determines the effect on the
undetermined equilibrium object.
O True
O False
Expert Solution
This question has been solved!
Explore an expertly crafted, step-by-step solution for a thorough understanding of key concepts.

This is a popular solution!

Trending now
This is a popular solution!

Step by step
Solved in 3 steps with 2 images

Knowledge Booster


Learn more about
Need a deep-dive on the concept behind this application? Look no further. Learn more about this topic, economics and related others by exploring similar questions and additional content below.Recommended textbooks for you


Exploring Economics
Economics
ISBN:
9781544336329
Author:
Robert L. Sexton
Publisher:
SAGE Publications, Inc
Exploring Economics
Economics
ISBN:
9781544336329
Author:
Robert L. Sexton
Publisher:
SAGE Publications, Inc


