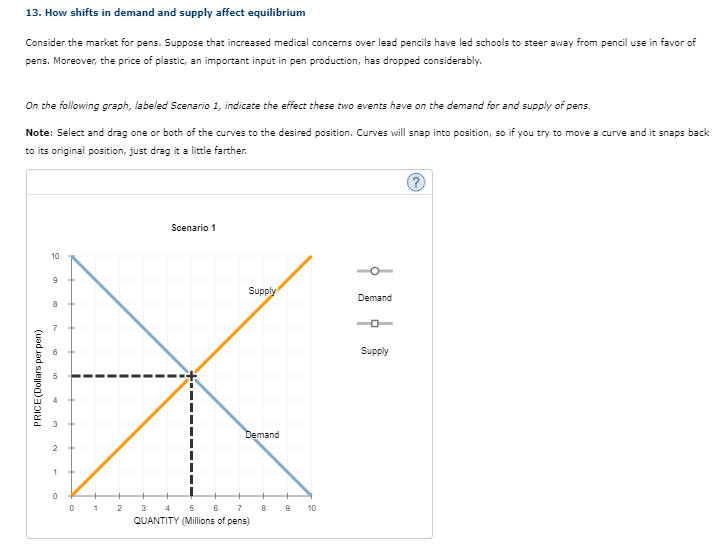
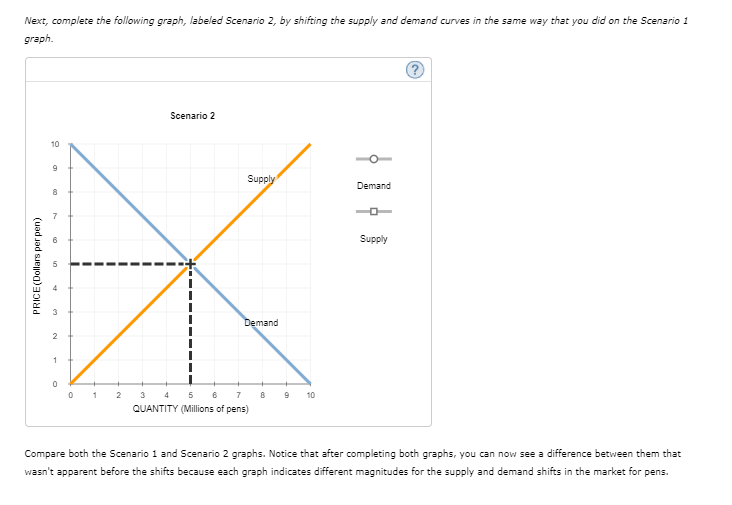
Use the results of your answers on both the Scenario 1 and Scenario 2 graphs to complete the following table. Begin by indicating the overall change in the equilibrium price and quantity after the shift in demand or supply for each shift-magnitude scenario. Then, in the final column, indicate the resulting change in the equilibrium price and quantity when supply and demand shift in the direction you previously indicated on both graphs. If you cannot determine the answer without knowing the magnitude of the shifts, choose Cannot determine. Change in Equilibrium Objects Scenario 1 Scenario 2 When Shift Magnitudes Are Unknown Price Quantity *option Increase, Decrease, Cannot Determine True or False: When both the demand and supply curves shift, the curve that shifts by the larger magnitude determines the effect on the undetermined equilibrium object.


Use the results of your answers on both the Scenario 1 and Scenario 2 graphs to complete the following table. Begin by indicating the overall change in the
|
Change in Equilibrium Objects
|
|||
|---|---|---|---|
|
Scenario 1
|
Scenario 2
|
When Shift Magnitudes Are Unknown
|
|
| Price | |||
| Quantity |
*option Increase, Decrease, Cannot Determine
True or False: When both the demand and supply curves shift, the curve that shifts by the larger magnitude determines the effect on the undetermined equilibrium object.


Trending now
This is a popular solution!

Step by step
Solved in 3 steps with 2 images


