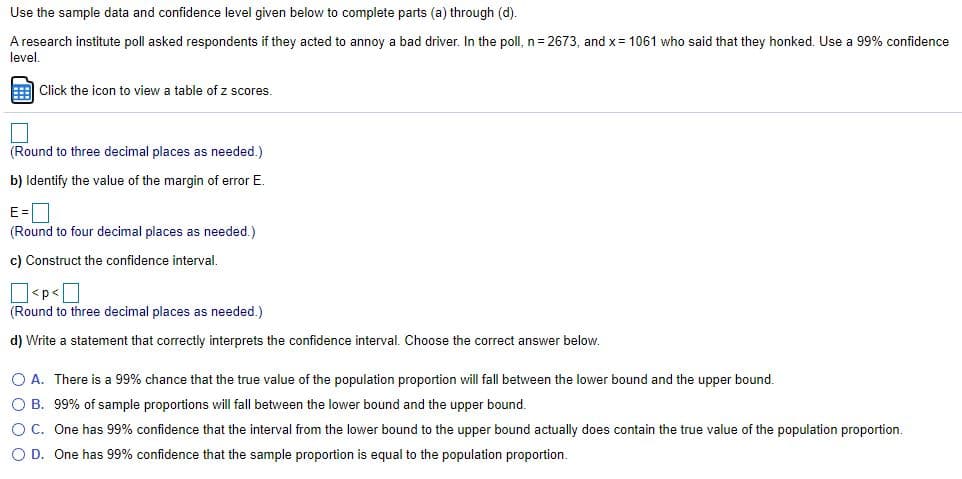
Use the sample data and confidence level given below to complete parts (a) through (d). A research institute poll asked respondents if they acted to annoy a bad driver. In the poll, n= 2673, and x= 1061 who said that they honked. Use a 99% confidence level. n3D Click the icon to view a table of z scores. (Round to three decimal places as needed.) b) Identify the value of the margin of error E. D E = (Round to four decimal places as needed.) c) Construct the confidence interval. (Round to three decimal places as needed.) d) Write a statement that correctly interprets the confidence interval. Choose the correct answer below. O A. There is a 99% chance that the true value of the population proportion will fall between the lower bound and the upper bound. O B. 99% of sample proportions will fall between the lower bound and the upper bound. OC. One has 99% confidence that the interval from the lower bound to the upper bound actually does contain the true value of the population proportion. O D. One has 99% confidence that the sample proportion is equal to the population proportion.
Use the sample data and confidence level given below to complete parts (a) through (d). A research institute poll asked respondents if they acted to annoy a bad driver. In the poll, n= 2673, and x= 1061 who said that they honked. Use a 99% confidence level. n3D Click the icon to view a table of z scores. (Round to three decimal places as needed.) b) Identify the value of the margin of error E. D E = (Round to four decimal places as needed.) c) Construct the confidence interval. (Round to three decimal places as needed.) d) Write a statement that correctly interprets the confidence interval. Choose the correct answer below. O A. There is a 99% chance that the true value of the population proportion will fall between the lower bound and the upper bound. O B. 99% of sample proportions will fall between the lower bound and the upper bound. OC. One has 99% confidence that the interval from the lower bound to the upper bound actually does contain the true value of the population proportion. O D. One has 99% confidence that the sample proportion is equal to the population proportion.
Glencoe Algebra 1, Student Edition, 9780079039897, 0079039898, 2018
18th Edition
ISBN:9780079039897
Author:Carter
Publisher:Carter
Chapter10: Statistics
Section10.5: Comparing Sets Of Data
Problem 1GP
Related questions
Topic Video
Question

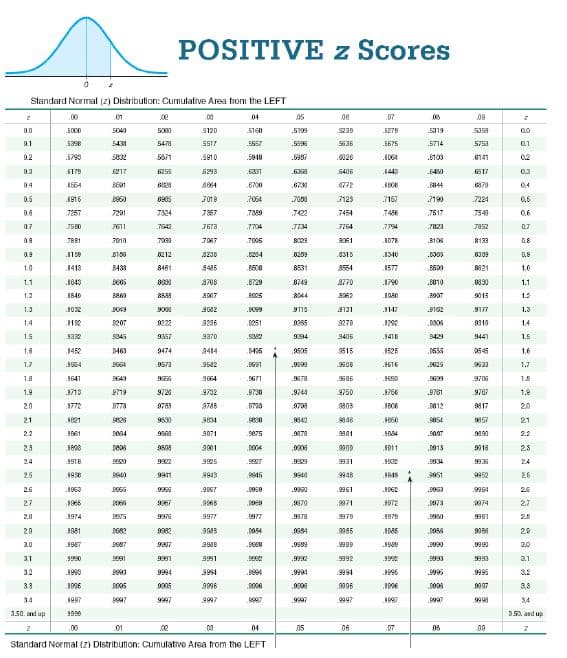
Transcribed Image Text:POSITIVE z Scores
Standard Normal (z) Distribution: Cumulative Area from the LEFT
.00
04
05
08
.07
08
D.0
5000
5040
.5120
5160
.5199
5239
5279
5319
5359
0.0
5398
5433
5478
517
55S7
9636
5675
.5714
5753
0.1
0.2
5790
5832
.5910
.5948
.5987
.0026
.6103
.6141
02
D.3
6179
6293
6331
6406
1443
6480
6517
0.3
04
4554
6700
673
6772
6844
.6879
04
0.6
1916
1950
7019
7054
7080
123
7167
.7190
7224
0.6
0.6
7257
7201
7324
7357
7389
.7422
7454
7486
7817
7549
0,6
07
7580
J611
7642
7673
7704
7734
7764
7794
7823
7852
D.7
08
7BB1
7010
7067
7905
8061
BD78
.B108
8133
D.8
0.9
0212
0315
1540
0.8
1.0
.1413
B433
8461
8485
8531
A554
1577
821
1.0
1.1
1843
.8729
8749
3770
1790
.B810
8830
1.1
1.2
I840
3007
8044
9015
1.2
1.3
a012
131
147
9177
1.3
1.4
22
A236
1251
2270
3292
1.4
1.5
5345
9357
9370
9394
3406
3418
3429
9441
1.5
1.6
1452
463
9474
9414
第15
165
0545
1.6
1.7
1564
9573
9582
.691
4616
1.7
1.8
1641
9643
9664
5671
978
9699
1.8
1.9
4713
9719
9720
9732
8738
.9744
9750
1766
.9761
9707
1.8
20
3772
D778
9789
3788
803
1808
1012
9817
2.0
21
3621
9830
934
9842
9846
9857
21
22
3871
se7s
9890
2.2
23
leas
3901
1004
3909
3011
1013
2.3
24
1918
9922
925
.9929
9931
.5834
9935
24
26
198
9849
9948
1949
9951
9962
2.6
26
9967
.961
.953
2.6
27
1965
9970
971
972
1073
9974
27
28
1974
Sers
9977
.9978
9979
3979
29
1981
985
20
30
.9999
1990
3.0
31
1990
9991
9991
.9992
9992
.5993
9993
31
3.2
1990
9994
9994
9994
9995
3.2
33
1996
9005
.900
8996
1006
3.3
34
1997
97
9999
34
3.50. and up
350. and up
.00
01
04
05
06
07
08
09
Standard Normal (zi Distribution: Cumulative Area from the LEFT

Transcribed Image Text:Use the sample data and confidence level given below to complete parts (a) through (d).
A research institute poll asked respondents if they acted to annoy a bad driver. In the poll, n= 2673, and x= 1061 who said that they honked. Use a 99% confidence
level.
E Click the icon to view a table of z scores.
(Round to three decimal places as needed.)
b) Identify the value of the margin of error E.
E=D
(Round to four decimal places as needed.)
c) Construct the confidence interval.
(Round to three decimal places as needed.)
d) Write a statement that correctly interprets the confidence interval. Choose the correct answer below.
O A. There is a 99% chance that the true value of the population proportion will fall between the lower bound and the upper bound.
O B. 99% of sample proportions will fall between the lower bound and the upper bound.
OC. One has 99% confidence that the interval from the lower bound to the upper bound actually does contain the true value of the population proportion.
O D. One has 99% confidence that the sample proportion is equal to the population proportion.
Expert Solution
This question has been solved!
Explore an expertly crafted, step-by-step solution for a thorough understanding of key concepts.
This is a popular solution!
Trending now
This is a popular solution!
Step by step
Solved in 2 steps with 4 images

Knowledge Booster
Learn more about
Need a deep-dive on the concept behind this application? Look no further. Learn more about this topic, statistics and related others by exploring similar questions and additional content below.Recommended textbooks for you

Glencoe Algebra 1, Student Edition, 9780079039897…
Algebra
ISBN:
9780079039897
Author:
Carter
Publisher:
McGraw Hill

Glencoe Algebra 1, Student Edition, 9780079039897…
Algebra
ISBN:
9780079039897
Author:
Carter
Publisher:
McGraw Hill