Use the sample data and confidence level given below to complete parts (a) through (d). A research institute poll asked respondents if they felt vulnerable to identity theft. In the poll, n= 1061 and x = 591 who said "yes." Use a 95% confidence level. | Click the icon to view a table of z scores. ..... a) Find the best point estimate of the population proportion p. (Round to three decimal places as needed.) b) Identify the value of the margin of error E. E =] (Round to three decimal places as needed.) c) Construct the confidence interval. O
Use the sample data and confidence level given below to complete parts (a) through (d). A research institute poll asked respondents if they felt vulnerable to identity theft. In the poll, n= 1061 and x = 591 who said "yes." Use a 95% confidence level. | Click the icon to view a table of z scores. ..... a) Find the best point estimate of the population proportion p. (Round to three decimal places as needed.) b) Identify the value of the margin of error E. E =] (Round to three decimal places as needed.) c) Construct the confidence interval. O

MATLAB: An Introduction with Applications
6th Edition
ISBN:9781119256830
Author:Amos Gilat
Publisher:Amos Gilat
Chapter1: Starting With Matlab
Section: Chapter Questions
Problem 1P

Related questions
Question
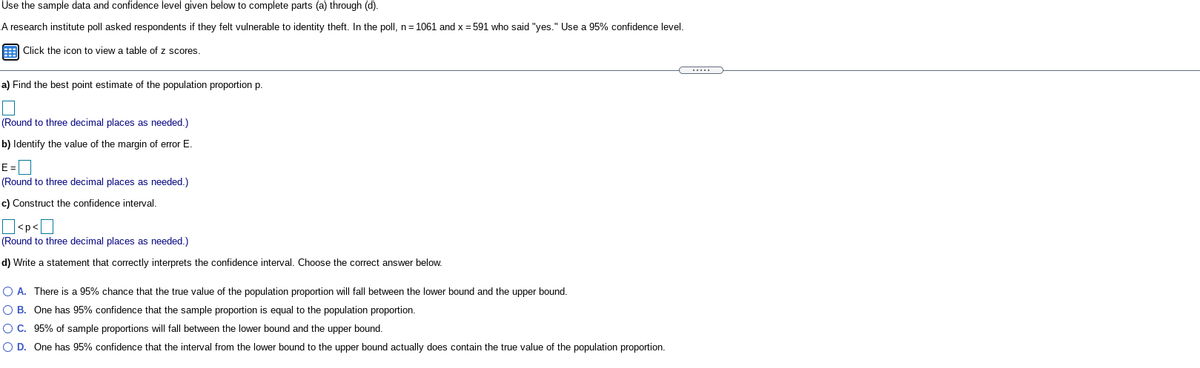
Transcribed Image Text:Use the sample data and confidence level given below to complete parts (a) through (d).
A research institute poll asked respondents if they felt vulnerable to identity theft. In the poll, n= 1061 and x = 591 who said "yes." Use a 95% confidence level.
E Click the icon to view a table of z scores
a) Find the best point estimate of the population proportion p
(Round to three decimal places as needed.)
b) Identify the value of the margin of error E.
E =
(Round to three decimal places as needed.)
c) Construct the confidence interval.
O<p<O
(Round to three decimal places as needed.)
d) Write a statement that correctly interprets the confidence interval. Choose the correct answer below.
O A. There is a 95% chance that the true value of the population proportion will fall between the lower bound and the upper bound.
O B. One has 95% confidence that the sample proportion is equal to the population proportion.
O C. 95% of sample proportions will fall between the lower bound and the upper bound.
O D. One has 95% confidence that the interval from the lower bound to the upper bound actually does contain the true value of the population proportion.
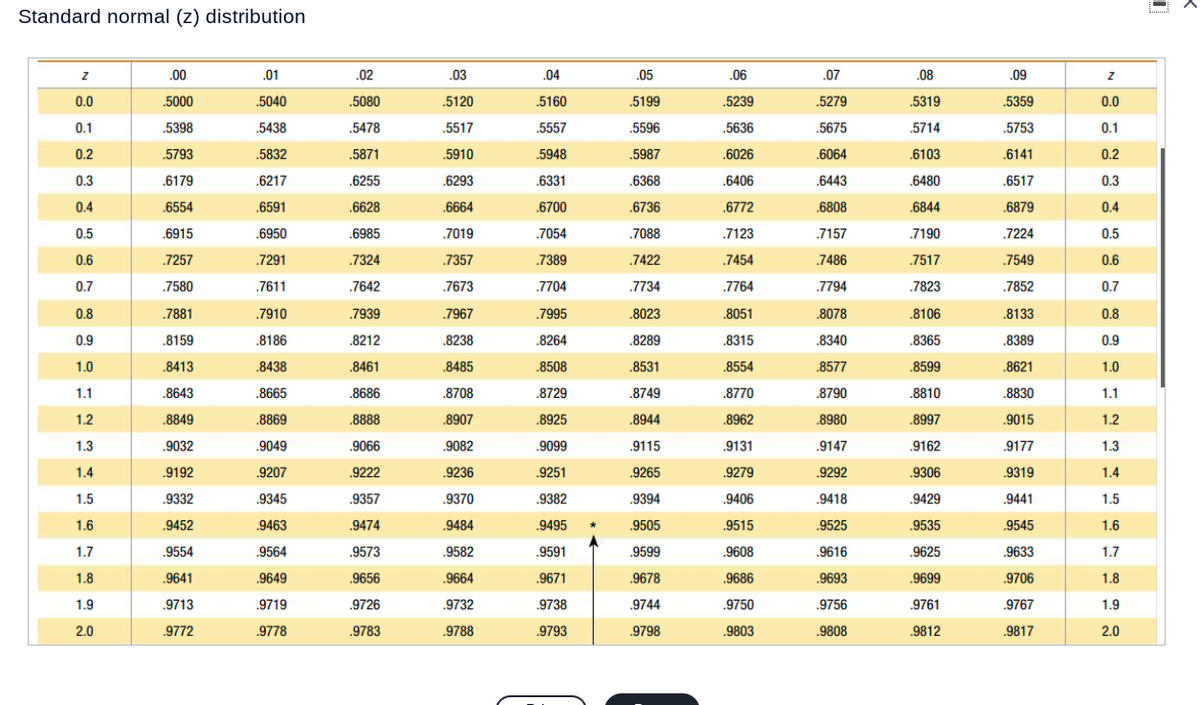
Transcribed Image Text:Standard normal (z) distribution
.00
.01
.02
.03
.04
.05
.06
.07
.08
.09
0.0
.5000
5040
5080
.5120
.5160
5199
.5239
.5279
.5319
.5359
0.0
0.1
5398
.5438
.5478
.5517
5557
.5596
.5636
.5675
.5714
.5753
0.1
0.2
5793
5832
5871
.5910
.5948
.5987
.6026
6064
.6103
6141
0.2
0.3
.6179
.6217
,6255
.6293
.6331
.6368
.6406
.6443
.6480
.6517
0.3
0.4
.6554
6591
.6628
.6664
.6700
.6736
6772
.6808
6844
.6879
0.4
0.5
.6915
.6950
.6985
.7019
.7054
.7088
.7123
.7157
.7190
.7224
0.5
0.6
.7257
.7291
7324
.7357
.7389
.7422
.7454
.7486
.7517
.7549
0.6
0.7
.7580
.7611
.7642
.7673
.7704
.7734
.7764
.7794
.7823
.7852
0.7
0.8
.7881
.7910
.7939
.7967
.7995
.8023
8051
.8078
.8106
.8133
0.8
0.9
8159
.8186
.8212
.8238
.8264
.8289
8315
.8340
.8365
.8389
0.9
1.0
.8413
.8438
.8461
.8485
.8508
.8531
.8554
.8577
8599
.8621
1.0
1.1
.8643
.8665
.8686
.8708
.8729
.8749
.8770
.8790
.8810
.8830
1.1
1.2
.8849
.8869
.8888
.8907
.8925
.8944
.8962
.8980
.8997
.9015
1.2
1.3
.9032
.9049
.9066
.9082
.9099
.9115
.9131
.9147
.9162
.9177
1.3
1.4
.9192
9207
9222
.9236
9251
.9265
.9279
.9292
.9306
.9319
1.4
1.5
.9332
.9345
.9357
.9370
9382
.9394
9406
9418
9429
.9441
1.5
1.6
9452
.9463
9474
9484
.9495
.9505
.9515
9525
.9535
.9545
1.6
1.7
.9554
.9564
.9573
9582
.9591
.9599
.9608
.9616
.9625
.9633
1.7
1.8
.9641
9649
.9656
.9664
.9671
9678
.9686
,9693
9699
9706
1.8
1.9
.9713
.9719
.9726
.9732
.9738
.9744
.9750
.9756
.9761
.9767
1.9
2.0
.9772
.9778
.9783
.9788
.9793
.9798
.9803
.9808
.9812
.9817
2.0
Expert Solution
This question has been solved!
Explore an expertly crafted, step-by-step solution for a thorough understanding of key concepts.

This is a popular solution!

Trending now
This is a popular solution!

Step by step
Solved in 2 steps with 2 images

Recommended textbooks for you
MATLAB: An Introduction with Applications
Statistics
ISBN:
9781119256830
Author:
Amos Gilat
Publisher:
John Wiley & Sons Inc

Probability and Statistics for Engineering and th…
Statistics
ISBN:
9781305251809
Author:
Jay L. Devore
Publisher:
Cengage Learning

Statistics for The Behavioral Sciences (MindTap C…
Statistics
ISBN:
9781305504912
Author:
Frederick J Gravetter, Larry B. Wallnau
Publisher:
Cengage Learning
MATLAB: An Introduction with Applications
Statistics
ISBN:
9781119256830
Author:
Amos Gilat
Publisher:
John Wiley & Sons Inc
Probability and Statistics for Engineering and th…
Statistics
ISBN:
9781305251809
Author:
Jay L. Devore
Publisher:
Cengage Learning
Statistics for The Behavioral Sciences (MindTap C…
Statistics
ISBN:
9781305504912
Author:
Frederick J Gravetter, Larry B. Wallnau
Publisher:
Cengage Learning

Elementary Statistics: Picturing the World (7th E…
Statistics
ISBN:
9780134683416
Author:
Ron Larson, Betsy Farber
Publisher:
PEARSON

The Basic Practice of Statistics
Statistics
ISBN:
9781319042578
Author:
David S. Moore, William I. Notz, Michael A. Fligner
Publisher:
W. H. Freeman

Introduction to the Practice of Statistics
Statistics
ISBN:
9781319013387
Author:
David S. Moore, George P. McCabe, Bruce A. Craig
Publisher:
W. H. Freeman