Use the sample data and confidence level given below to complete parts (a) through (d). A research institute poll asked respondents if they felt vulnerable to identity theft. In the poll, n= 1069 and x= 534 who said "yes." Use a 90% confidence level. Click the icon to view a table of z scores. a) Find the best point estimate of the population proportion p. (Round to three decimal places as needed.) b) Identify the value of the margin of error E. E= (Round to three decimal places as needed.) c) Construct the confidence interval.
Use the sample data and confidence level given below to complete parts (a) through (d). A research institute poll asked respondents if they felt vulnerable to identity theft. In the poll, n= 1069 and x= 534 who said "yes." Use a 90% confidence level. Click the icon to view a table of z scores. a) Find the best point estimate of the population proportion p. (Round to three decimal places as needed.) b) Identify the value of the margin of error E. E= (Round to three decimal places as needed.) c) Construct the confidence interval.

Holt Mcdougal Larson Pre-algebra: Student Edition 2012
1st Edition
ISBN:9780547587776
Author:HOLT MCDOUGAL
Publisher:HOLT MCDOUGAL
Chapter11: Data Analysis And Probability
Section11.4: Collecting Data
Problem 3E

Related questions

Topic Video
Question
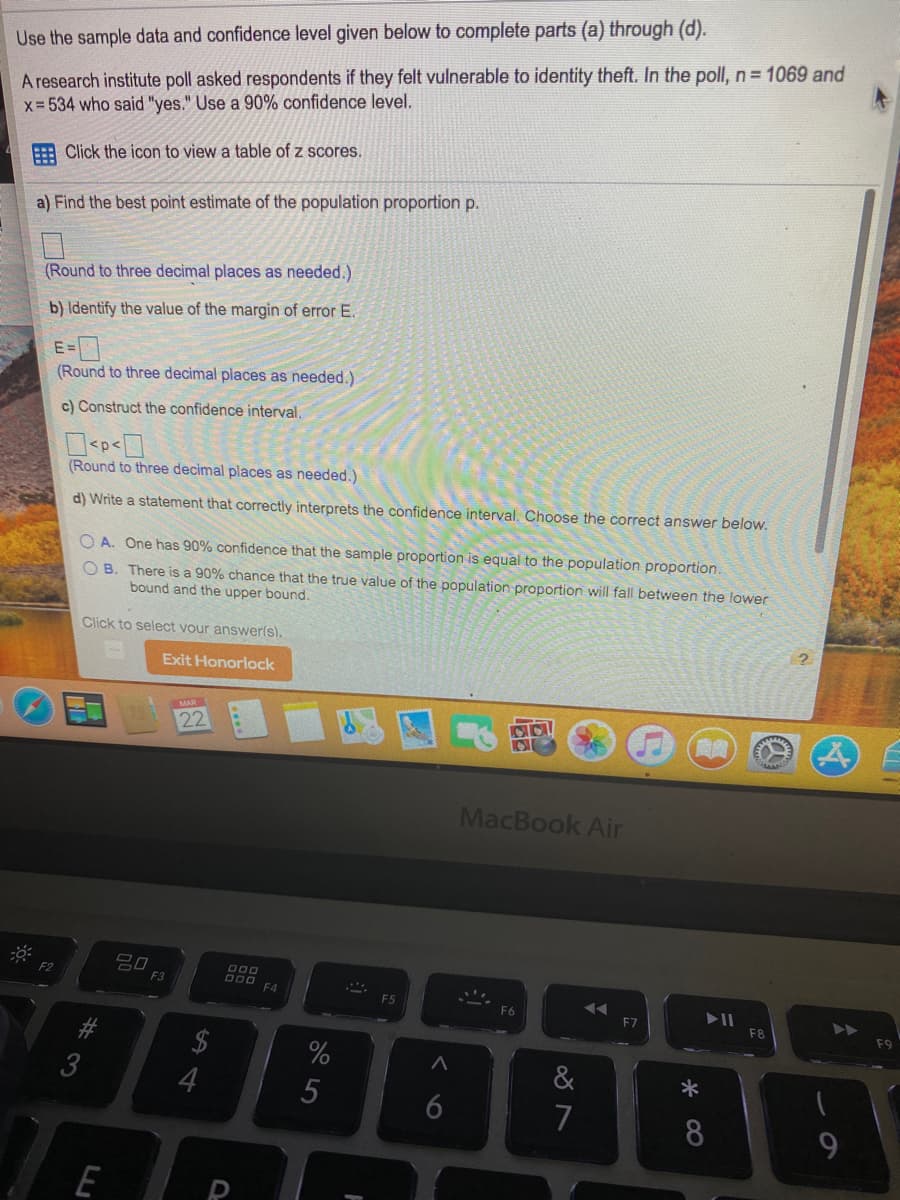
Transcribed Image Text:A research institute poll asked respondents if they felt vulnerable to identity theft. In the poll, n= 1069 and
x- 534 who said "yes." Use a 90% confidence level.
Use the sample data and confidence level given below to complete parts (a) through (d).
Click the icon to view a table of z scores.
a) Find the best point estimate of the population proportion p.
(Round to three decimal places as needed.)
b) Identify the value of the margin of error E.
E=
(Round to three decimal places as needed.)
c) Construct the confidence interval.
(Round to three decimal places as needed.)
d) Write a statement that correctly interprets the confidence interval. Choose the correct answer below.
O A. One has 90% confidence that the sample proportion is equal to the population proportion.
O B. There is a 90% chance that the true value of the population proportion will fall between the lower
bound and the upper bound.
2.
Click to select vour answerls).
Exit Honorlock
22
MacBook Air
吕口
F3
000
O00 F4
F2
F5
F6
F7
F8
F9
%
&
*
4
5
7
8
E
6
#3
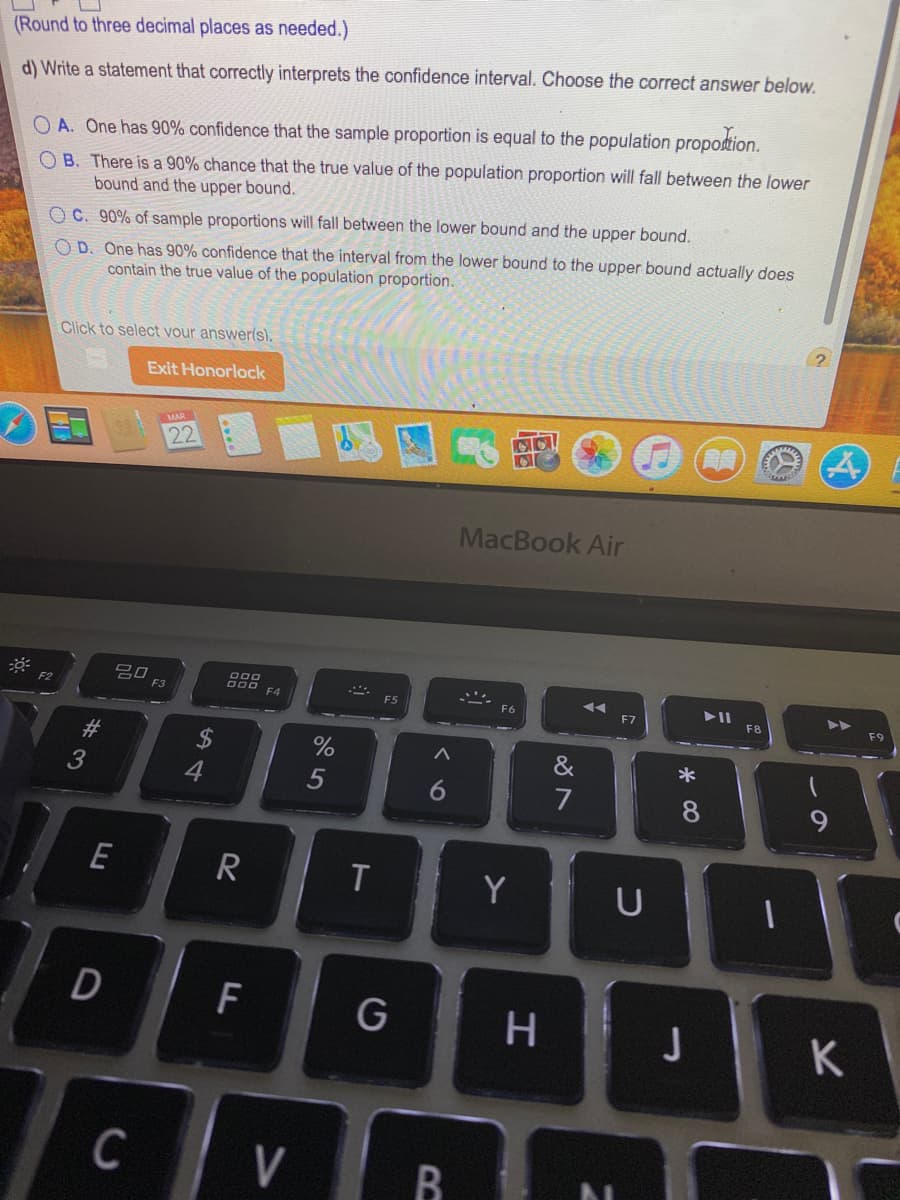
Transcribed Image Text:(Round to three decimal places as needed.)
d) Write a statement that correctly interprets the confidence interval. Choose the correct answer below.
O A. One has 90% confidence that the sample proportion is equal to the population propodtion.
O B. There is a 90% chance that the true value of the population proportion will fall between the lower
bound and the upper bound.
O C. 90% of sample proportions will fall between the lower bound and the upper bound.
O D. One has 90% confidence that the interval from the lower bound to the upper bound actually does
contain the true value of the population proportion.
Click to select vour answerls).
Exit Honorlock
22
MacBook Air
吕口
F3
F4
F5
F7
F8
F9
23
2$
&
*
3
4
5
6.
7
8.
E
R
Y
D
F
G
K
C
V>
Expert Solution
This question has been solved!
Explore an expertly crafted, step-by-step solution for a thorough understanding of key concepts.

This is a popular solution!

Trending now
This is a popular solution!

Step by step
Solved in 3 steps with 3 images

Knowledge Booster


Learn more about
Need a deep-dive on the concept behind this application? Look no further. Learn more about this topic, statistics and related others by exploring similar questions and additional content below.Recommended textbooks for you
Holt Mcdougal Larson Pre-algebra: Student Edition…
Algebra
ISBN:
9780547587776
Author:
HOLT MCDOUGAL
Publisher:
HOLT MCDOUGAL

College Algebra (MindTap Course List)
Algebra
ISBN:
9781305652231
Author:
R. David Gustafson, Jeff Hughes
Publisher:
Cengage Learning
Holt Mcdougal Larson Pre-algebra: Student Edition…
Algebra
ISBN:
9780547587776
Author:
HOLT MCDOUGAL
Publisher:
HOLT MCDOUGAL
College Algebra (MindTap Course List)
Algebra
ISBN:
9781305652231
Author:
R. David Gustafson, Jeff Hughes
Publisher:
Cengage Learning