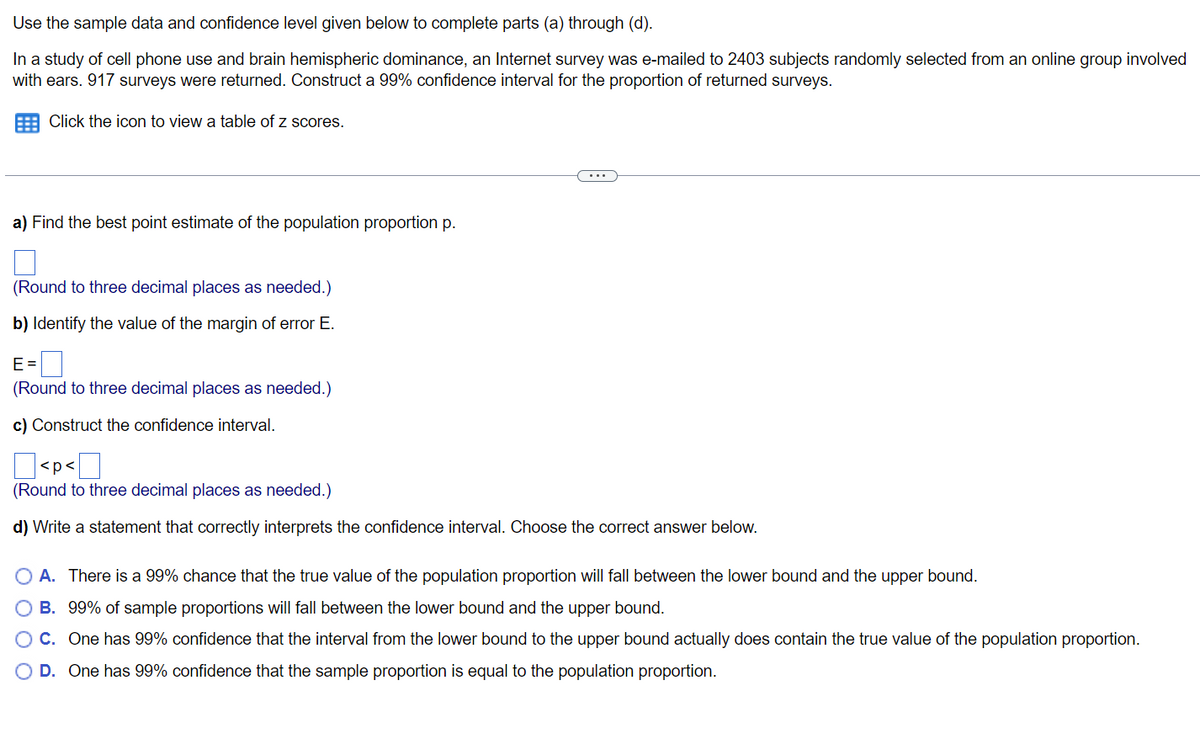
Use the sample data and confidence level given below to complete parts (a) through (d). In a study of cell phone use and brain hemispheric dominance, an Internet survey was e-mailed to 2403 subjects randomly selected from an online group involved with ears. 917 surveys were returned. Construct a 99% confidence interval for the proportion of returned surveys. Click the icon to view a table of z scores. a) Find the best point estimate of the population proportion p. (Round to three decimal places as needed.) b) Identify the value of the margin of error E. E= (Round to three decimal places as needed.) c) Construct the confidence interval.
Use the sample data and confidence level given below to complete parts (a) through (d). In a study of cell phone use and brain hemispheric dominance, an Internet survey was e-mailed to 2403 subjects randomly selected from an online group involved with ears. 917 surveys were returned. Construct a 99% confidence interval for the proportion of returned surveys. Click the icon to view a table of z scores. a) Find the best point estimate of the population proportion p. (Round to three decimal places as needed.) b) Identify the value of the margin of error E. E= (Round to three decimal places as needed.) c) Construct the confidence interval.

College Algebra (MindTap Course List)
12th Edition
ISBN:9781305652231
Author:R. David Gustafson, Jeff Hughes
Publisher:R. David Gustafson, Jeff Hughes
Chapter8: Sequences, Series, And Probability
Section8.7: Probability
Problem 8E: List the sample space of each experiment. Picking a one-digit number

Related questions
Question
Transcribed Image Text:Use
the sample data and confidence level given below to complete parts (a) through (d).
In a study of cell phone use and brain hemispheric dominance, an Internet survey was e-mailed to 2403 subjects randomly selected from an online group involved
with ears. 917 surveys were returned. Construct a 99% confidence interval for the proportion of returned surveys.
Click the icon to view a table of z scores.
a) Find the best point estimate of the population proportion p.
(Round to three decimal places as needed.)
b) Identify the value of the margin of error E.
E=
(Round to three decimal places needed.)
c) Construct the confidence interval.
<p<
0
(Round to three decimal places as needed.)
d) Write a statement that correctly interprets the confidence interval. Choose the correct answer below.
A. There is a 99% chance that the true value of the population proportion will fall between the lower bound and the upper bound.
B. 99% of sample proportions will fall between the lower bound and the upper bound.
O C. One has 99% confidence that the interval from the lower bound to the upper bound actually does contain the true value of the population proportion.
O D. One has 99% confidence that the sample proportion is equal to the population proportion.
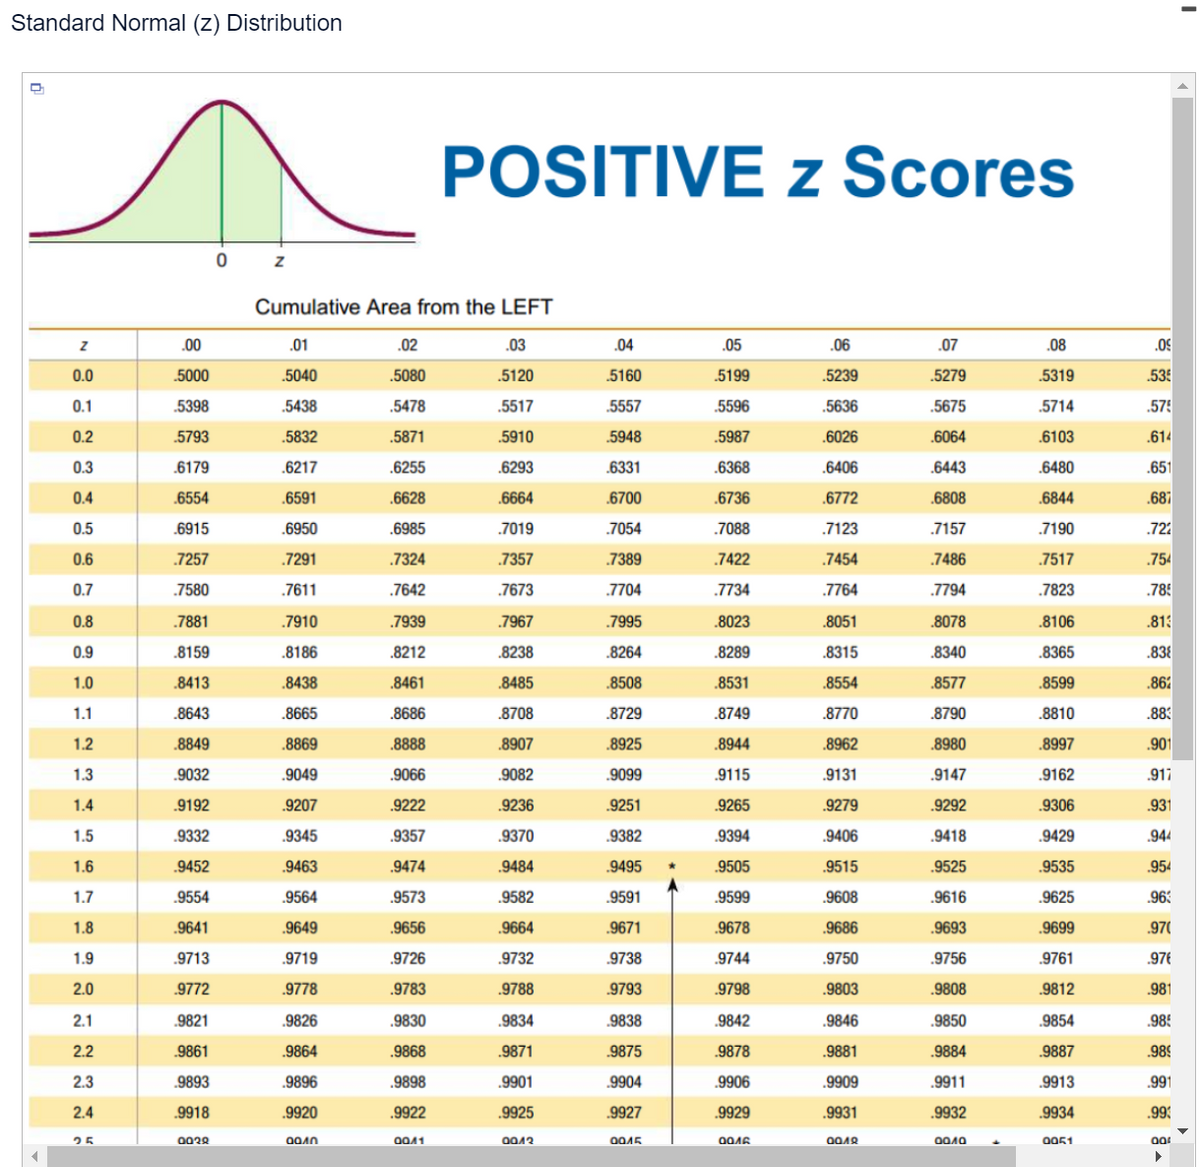
Transcribed Image Text:Standard Normal (z) Distribution
Q
0
Z
Cumulative Area from the LEFT
.01
.02
.03
.5040
.5080
.5120
5438
.5478
.5517
.5832
.5871
.5910
.6217
.6255
.6293
.6591
.6628
.6664
.6950
.6985
.7019
.7291
.7324
.7357
.7611
.7642
.7673
.7910
.7939
.7967
.8186
.8212
.8238
.8438
.8461
.8485
.8665
.8686
.8708
.8869
.8888
.8907
.9049
.9066
.9082
.9207
.9222
.9236
.9345
.9357
.9370
.9463
.9474
.9484
9564
.9573
.9582
.9649
.9656
.9664
.9719
.9726
.9732
.9778
.9783
.9788
.9826
.9830
.9834
.9864
.9868
.9871
.9896
.9898
.9901
.9920
.9922
.9925
091
0041
0912
Z
0.0
0.1
0.2
0.3
0.4
0.5
0.6
0.7
0.8
0.9
1.0
1.1
1.2
1.3
1.4
1.5
1.6
1.7
1.8
1.9
2.0
2.1
2.2
2.3
2.4
25
.00
5000
5398
5793
.6179
.6554
.6915
.7257
.7580
.7881
.8159
.8413
.8643
.8849
.9032
.9192
.9332
9452
.9554
.9641
9713
9772
.9821
.9861
9893
.9918
0020
POSITIVE Z Scores
z
.04
.05
.06
.07
.08
5160
5199
.5239
.5279
5319
5557
5596
.5636
.5675
.5714
.5948
.5987
.6026
.6064
.6103
.6331
.6368
.6406
.6443
.6480
.6700
.6736
.6772
.6808
.6844
.7054
.7088
.7123
.7157
.7190
.7389
.7422
.7454
.7486
.7517
.7704
.7734
.7764
.7794
.7823
.7995
.8023
.8051
.8078
.8106
.8264
.8289
.8315
.8340
.8365
.8508
.8531
.8554
.8577
.8599
.8729
.8749
.8770
.8790
8810
.8925
.8944
.8962
.8980
.8997
.9099
.9115
.9131
.9147
.9162
.9251
.9265
.9279
.9292
.9306
.9382
.9394
.9406
.9418
.9429
.9495
.9505
.9515
.9525
.9535
9591
9599
.9608
.9616
9625
.9671
9678
.9686
.9693
.9699
.9738
9744
.9750
.9756
.9761
9793
9798
.9803
.9808
.9812
.9838
.9842
.9846
.9850
.9854
.9875
.9878
.9881
.9884
.9887
.9904
.9906
.9909
.9911
.9913
9927
.9929
.9931
.9932
.9934
0015
0016
0012
ООЛО
0051
.09
535
.575
.614
.651
.687
.722
.754
.785
.813
.838
.862
.883
.901
.917
.931
.944
.954
.963
.97(
.97€
.981
.985
.989
.991
.993
00
I
Expert Solution
This question has been solved!
Explore an expertly crafted, step-by-step solution for a thorough understanding of key concepts.

Step by step
Solved in 4 steps

Recommended textbooks for you
College Algebra (MindTap Course List)
Algebra
ISBN:
9781305652231
Author:
R. David Gustafson, Jeff Hughes
Publisher:
Cengage Learning

Glencoe Algebra 1, Student Edition, 9780079039897…
Algebra
ISBN:
9780079039897
Author:
Carter
Publisher:
McGraw Hill
College Algebra (MindTap Course List)
Algebra
ISBN:
9781305652231
Author:
R. David Gustafson, Jeff Hughes
Publisher:
Cengage Learning
Glencoe Algebra 1, Student Edition, 9780079039897…
Algebra
ISBN:
9780079039897
Author:
Carter
Publisher:
McGraw Hill