Use the supply and demand curves in the accompanying graph. At what price are 10 items supplied? Ten items are supplied at a price of $. 200- 180- 160- HDemand 140 120- 100- 80-Supply 60- 40- 20- 0- 2 4 6 8 10 12 14 16 18 20 Quantity Enter your answer in the answer box. Save for Later Price in dollars
Use the supply and demand curves in the accompanying graph. At what price are 10 items supplied? Ten items are supplied at a price of $. 200- 180- 160- HDemand 140 120- 100- 80-Supply 60- 40- 20- 0- 2 4 6 8 10 12 14 16 18 20 Quantity Enter your answer in the answer box. Save for Later Price in dollars

Chapter7: Systems Of Equations And Inequalities
Section7.3: Systems Of Nonlinear Equations And Inequalities: Two Variables
Problem 4SE: If you graph a revenue and cost function, explain how to determine in what regions there is profit.

Related questions

Question
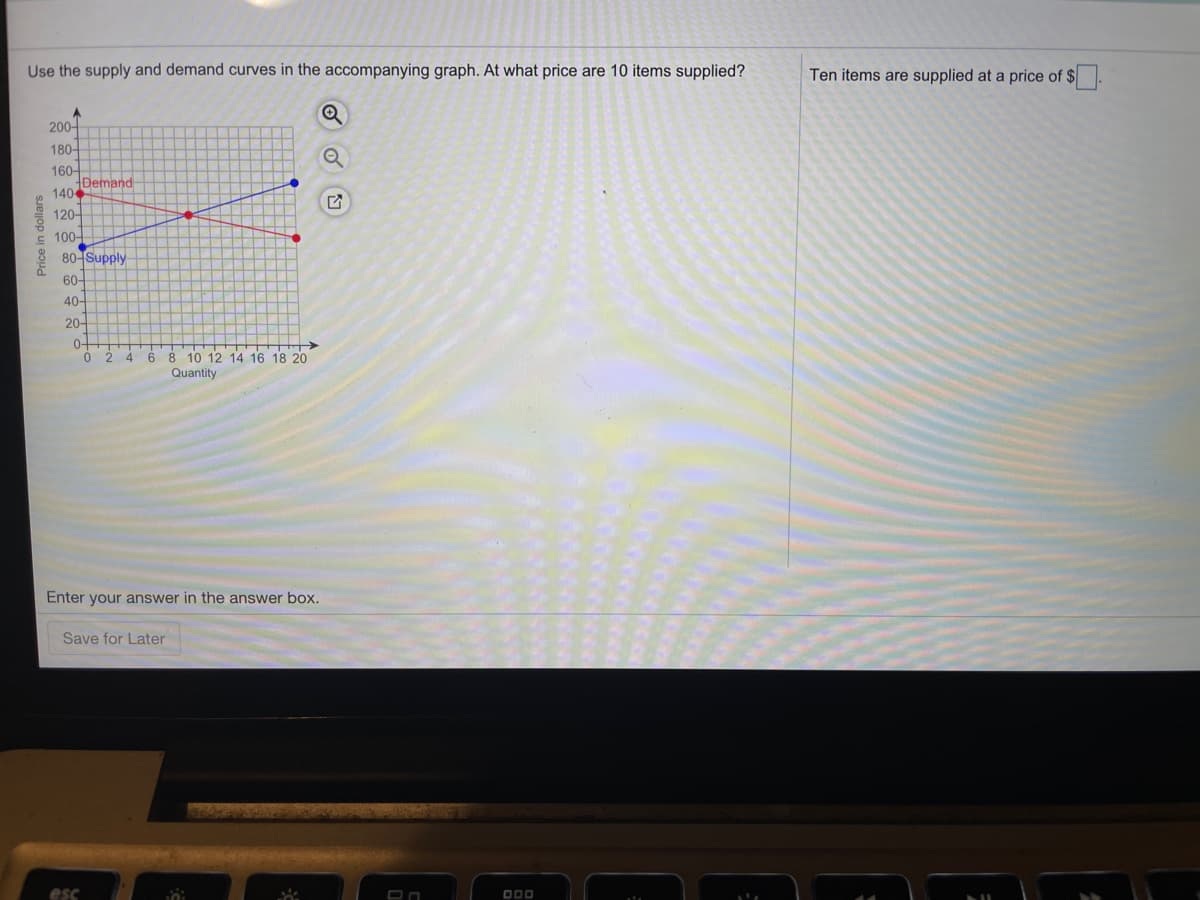
Transcribed Image Text:Use the supply and demand curves in the accompanying graph. At what price are 10 items supplied?
Ten items are supplied at a price of $.
200-
180-
160-
HDemand
140
120-
100-
80 Supply
60어
40-
20-
0-
2 4 6 8 10 12 14 16 18 20
Quantity
Enter your answer in the answer box.
Save for Later
esc
D00
Price in dollars
Expert Solution
This question has been solved!
Explore an expertly crafted, step-by-step solution for a thorough understanding of key concepts.

This is a popular solution!

Trending now
This is a popular solution!

Step by step
Solved in 2 steps with 1 images

Knowledge Booster


Learn more about
Need a deep-dive on the concept behind this application? Look no further. Learn more about this topic, advanced-math and related others by exploring similar questions and additional content below.Recommended textbooks for you

Algebra for College Students
Algebra
ISBN:
9781285195780
Author:
Jerome E. Kaufmann, Karen L. Schwitters
Publisher:
Cengage Learning
Algebra for College Students
Algebra
ISBN:
9781285195780
Author:
Jerome E. Kaufmann, Karen L. Schwitters
Publisher:
Cengage Learning