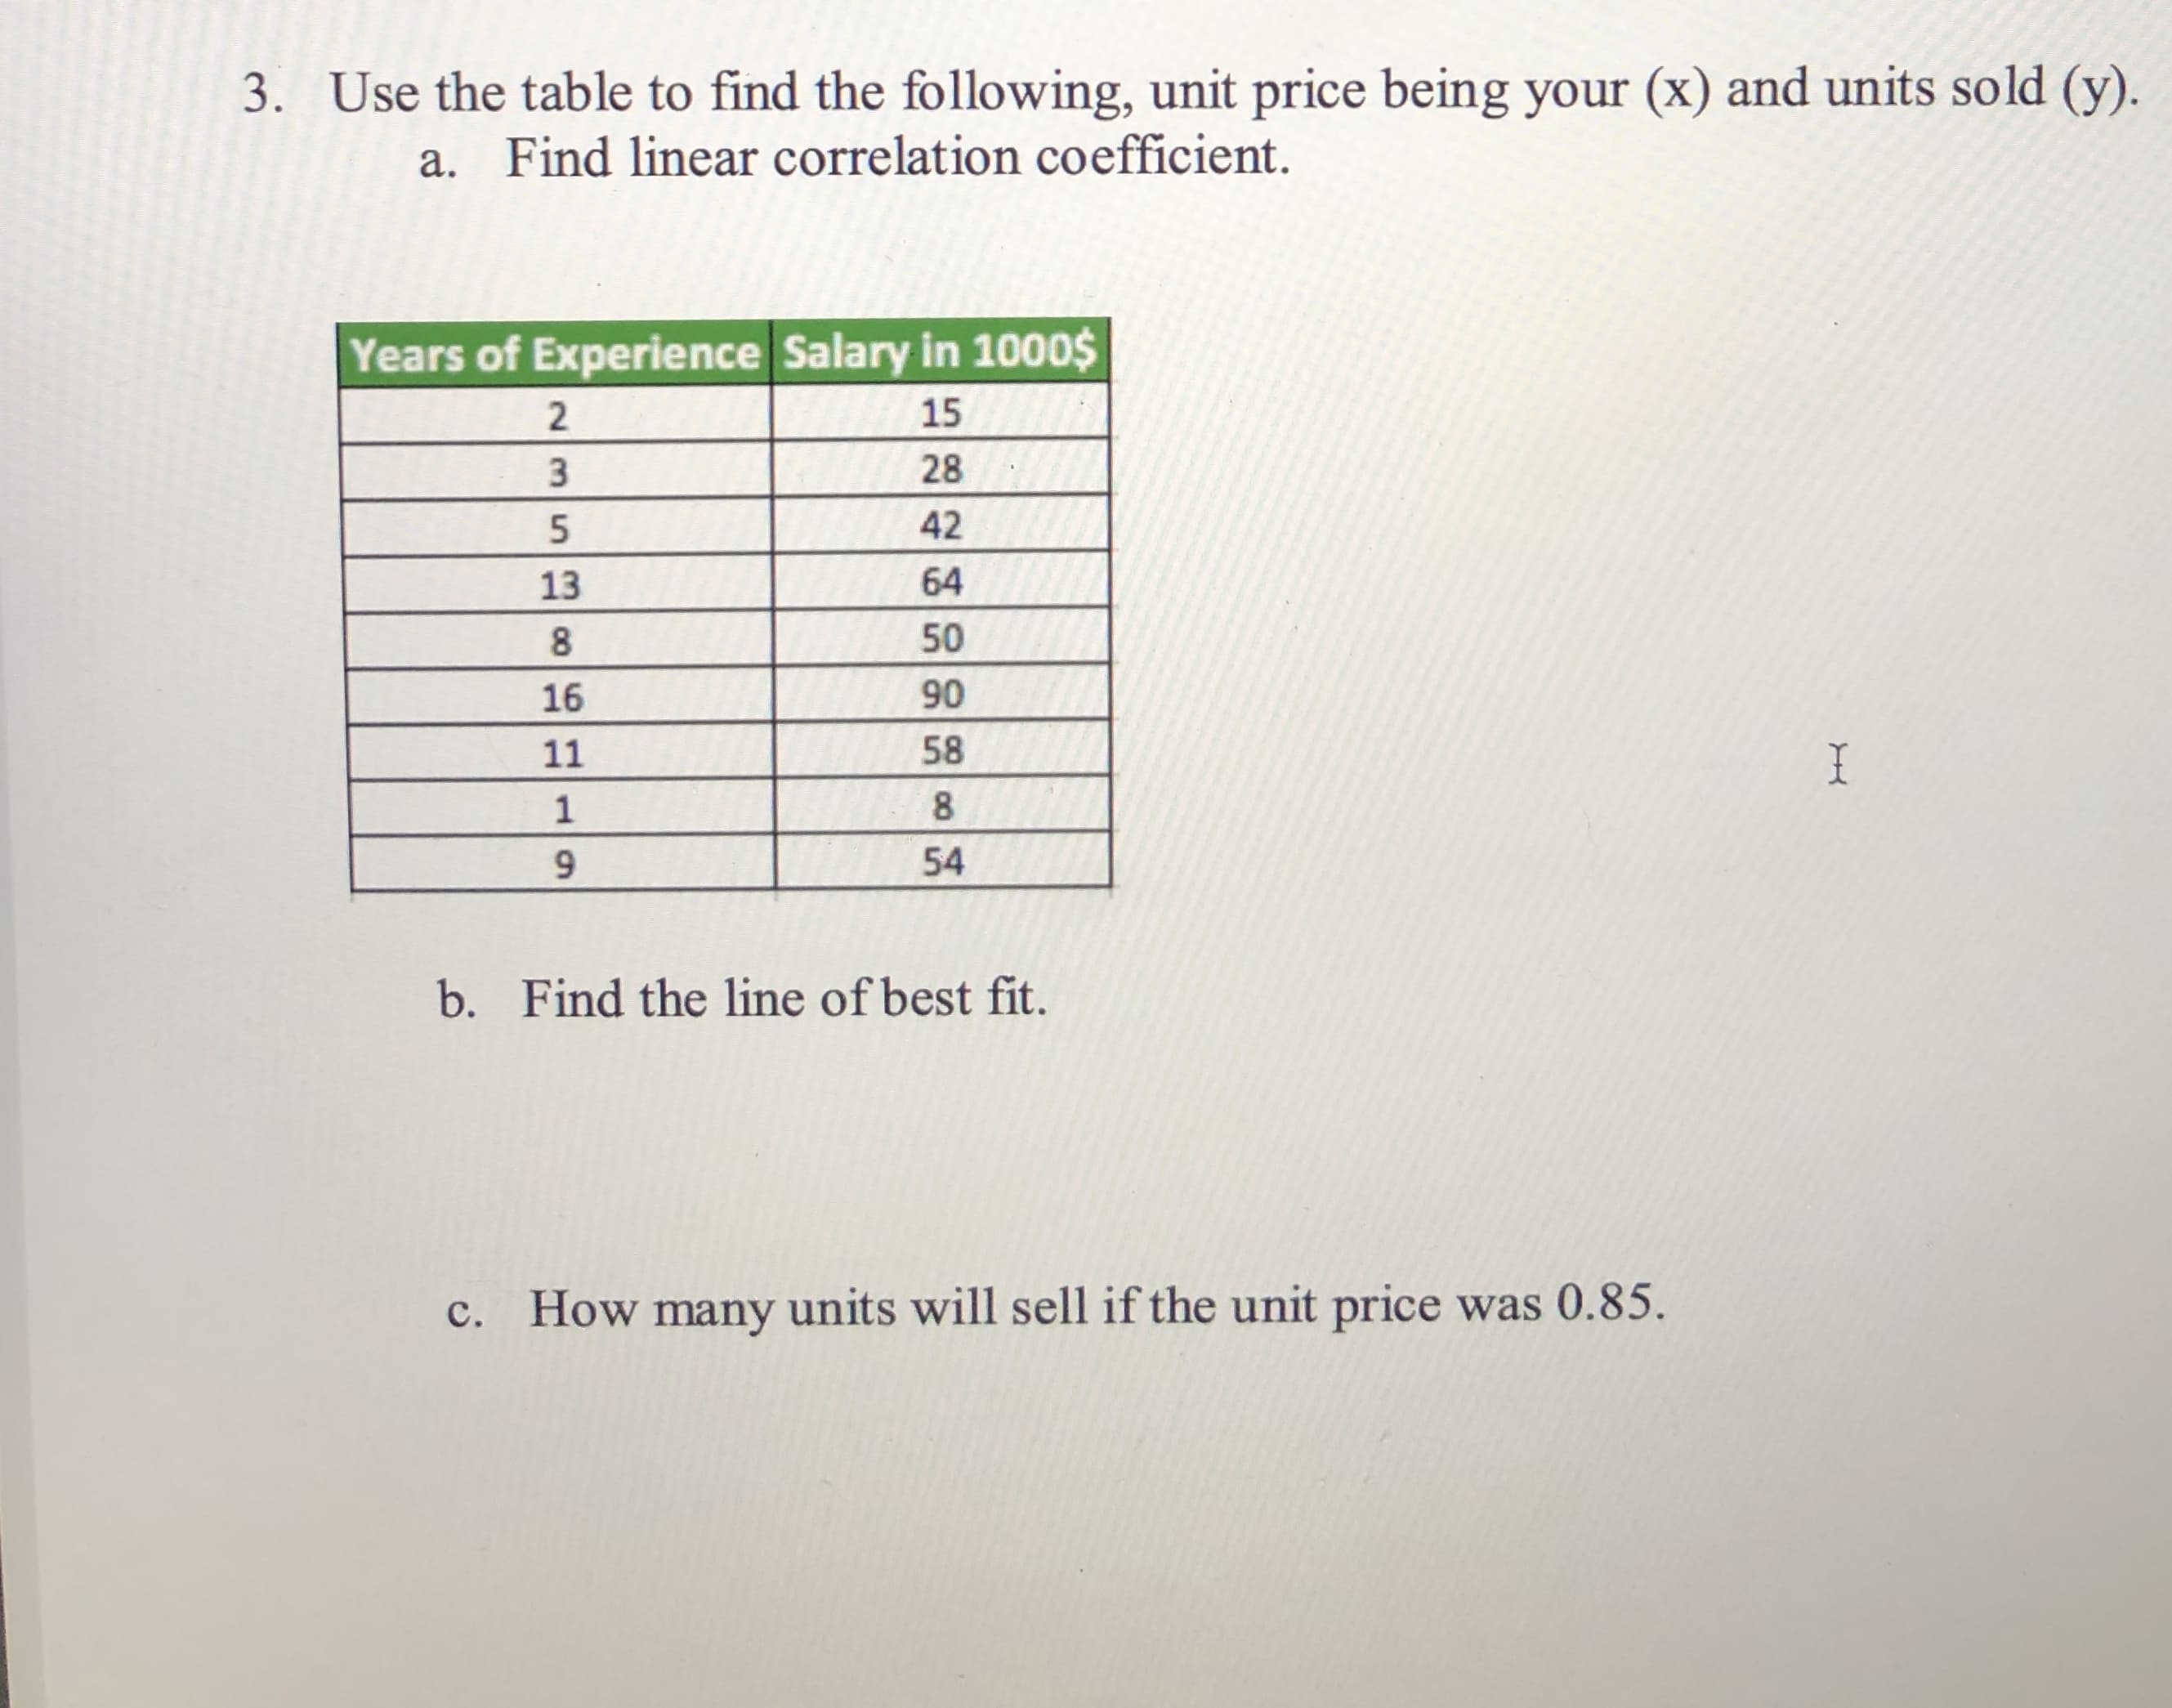
MATLAB: An Introduction with Applications
6th Edition
ISBN: 9781119256830
Author: Amos Gilat
Publisher: John Wiley & Sons Inc
expand_more
expand_more
format_list_bulleted
Concept explainers
Question
![**Question 3: Analyzing Data Using Linear Regression Techniques**
**a. Find Linear Correlation Coefficient.**
To start, we must calculate the linear correlation coefficient for the given data set. The data pairs are given in a table with the "Years of Experience" as the independent variable (x) and "Salary in 1000$" as the dependent variable (y).
| Years of Experience | Salary in 1000$ |
|---------------------|-----------------|
| 2 | 15 |
| 3 | 28 |
| 5 | 42 |
| 13 | 64 |
| 8 | 50 |
| 16 | 90 |
| 11 | 58 |
| 1 | 8 |
| 9 | 54 |
**b. Find the Line of Best Fit.**
The line of best fit is a straight line drawn through the center of a group of data points plotted on a scatter plot. This line represents the best estimate of the relationship between the variables. The linear equation is typically written as:
\[ y = mx + b \]
where \( m \) is the slope and \( b \) is the y-intercept.
**c. Predict Sales Based on Unit Price**
Using the line of best fit found in part (b), determine the expected number of units sold if the unit price was 0.85.
**Calculation Steps:**
1. Construct a scatter plot of the data points.
2. Use formulas for the linear regression line to calculate the slope (\( m \)) and y-intercept (\( b \)).
3. Substitute \( x = 0.85 \) into the regression equation to predict the corresponding \( y \)-value.
These steps can be performed using statistical software or a graphing calculator to expedite calculations. Observing the trend and assessing the strength of the relationship between variables can provide insight into the significance of the correlation and predictive power of the derived model.
**Educational Purpose:**
Through this exercise, students will learn to:
1. Calculate the linear correlation coefficient to measure the strength and direction of a linear relationship.
2. Determine the equation of the line of best fit to model data through linear regression.
3. Use regression equations for predictions, reinforcing the connection between algebraic and real-world applications.
Analyzing this dataset will also lend understanding to how empirical relationships are](https://content.bartleby.com/qna-images/question/67f8d32e-7653-460d-a7f7-5cc77c157184/425bd360-a31e-4311-9b7a-d3c1ff050819/w9jytdb_thumbnail.jpeg)
Transcribed Image Text:**Question 3: Analyzing Data Using Linear Regression Techniques**
**a. Find Linear Correlation Coefficient.**
To start, we must calculate the linear correlation coefficient for the given data set. The data pairs are given in a table with the "Years of Experience" as the independent variable (x) and "Salary in 1000$" as the dependent variable (y).
| Years of Experience | Salary in 1000$ |
|---------------------|-----------------|
| 2 | 15 |
| 3 | 28 |
| 5 | 42 |
| 13 | 64 |
| 8 | 50 |
| 16 | 90 |
| 11 | 58 |
| 1 | 8 |
| 9 | 54 |
**b. Find the Line of Best Fit.**
The line of best fit is a straight line drawn through the center of a group of data points plotted on a scatter plot. This line represents the best estimate of the relationship between the variables. The linear equation is typically written as:
\[ y = mx + b \]
where \( m \) is the slope and \( b \) is the y-intercept.
**c. Predict Sales Based on Unit Price**
Using the line of best fit found in part (b), determine the expected number of units sold if the unit price was 0.85.
**Calculation Steps:**
1. Construct a scatter plot of the data points.
2. Use formulas for the linear regression line to calculate the slope (\( m \)) and y-intercept (\( b \)).
3. Substitute \( x = 0.85 \) into the regression equation to predict the corresponding \( y \)-value.
These steps can be performed using statistical software or a graphing calculator to expedite calculations. Observing the trend and assessing the strength of the relationship between variables can provide insight into the significance of the correlation and predictive power of the derived model.
**Educational Purpose:**
Through this exercise, students will learn to:
1. Calculate the linear correlation coefficient to measure the strength and direction of a linear relationship.
2. Determine the equation of the line of best fit to model data through linear regression.
3. Use regression equations for predictions, reinforcing the connection between algebraic and real-world applications.
Analyzing this dataset will also lend understanding to how empirical relationships are
Expert Solution

This question has been solved!
Explore an expertly crafted, step-by-step solution for a thorough understanding of key concepts.
This is a popular solution
Trending nowThis is a popular solution!
Step by stepSolved in 3 steps with 4 images

Knowledge Booster
Learn more about
Need a deep-dive on the concept behind this application? Look no further. Learn more about this topic, statistics and related others by exploring similar questions and additional content below.Similar questions
- TRY IT YOURSELF 1 A director of alumni affairs at a small college wants to determine whether here is a linear relationship between the number of years alumni have been out of school and their annual contributions (in thousands of dollars). The data are shown in the table below. Display the data in a scatter plot and describe the type of correlation. Number of years 1 10 15 24 30 out of school, x Annual contribution 12.5 8.7 14.6 5.2 9.9 3.1 2.7 (in 1000s of $), y 3.arrow_forwardI w 6 9 1 12 X 2 3 5 7 10 11 12 15 16 y 62 67 65 86 80 85 88 84 92 ▸ Determine the correlation coefficient for this set of data and define the strength and direction of the correlation.arrow_forwardHELP WITH THIS PROBLEMarrow_forward
- An economist want to determine the relation between one’s FICO score, x, and the interest rate of a 36-month auto loan, y. The given data represent the interest rate (in percent) a bank would offer on a 36-month auto load for various FICO scores. Credit Score;x Interest Rate (percent);y 545 18.982 595 17.967 640 12.218 675 8.612 705 6.68 750 5.15 Find the least-squares regression line treating the FICO score as the explanatory variable and the interest rate as the response variable. Predict the interest rate a person would pay if their FICO score were the median score of 723.arrow_forwardA researcher is interested in whether the variation in the size of human beings is proportional throughout each part of the human. To partly answer this question they looked at the correlation between the foot length (in millimeters) and height (in centimeters) of 30 randomly selected adult males. The data is provided below. Use Excel to calculate the correlation coefficient r between the two data sets. Round your answer to two decimal places. Foot length (mm) Height length (cm) 269.1 188.6 245.7 177.5 272.7 166.9 271.8 155.1 273.9 144.3 274.7 133.8 255.7 122.6 276.5 157.4 279.6 145.9 280.1 135.6 281.9 123.5 HelpCopy to ClipboardDownload CSVarrow_forwardUsing the scatter plot of the registered nurse salary data shown, what type of correlation, if any do you think the data have? Explain. Registered Nurses 70 O A. There appears to be a strong positive linear correlation. As the years of experience of the registered nurses increase, salaries tend to decrease. 65 60 O B. There appears to be a strong positive linear correlation. As the years of experience of the registered nurses increase, salaries tend to increase. 55 50 OC. There appears to be a strong negative linear correlation. As the years of experience of the registered nurses increase, salaries tend to decrease. 45 40 O D. There does not appear to be any linear correlation. 2 46 8 10 12 14 16 18 20 22 24 Years of experience O Time Remaining: MacBook Air 80 esc F9 F10 F1 F2 F3 F4 F5 F6 F7 F8 23 $ & 1 7 Annual salary (in thousands) * COarrow_forward
- The following graph plots data for tax per gallon and internal miles.Carefully explain what the graph is about, and what it captures. What are the limitations of the correlation and what can a researcher do toovercome these?arrow_forwardsub-part 3. please help me with the rest. thanksarrow_forwardThe table shows the number of absences, x, in a class and the final exam grade, y, for seven students. X 1 0 2 6 4 3 3 Y 95 90 90 55 70 80 85 Use the graphing calculator to find the correlation coefficient. (Round answer to three decimal places. Do not write 0.123 as.123.)arrow_forward
- Identify the reasons the following statements are incorrect. Not all reasons will be used. Researchers found that the correlation between the number of pages in novels and Correlation should depend on units. the number of hours it takes to read them is r = 0.71 pages. The correlation between the advertised selling price of cars and the makes of the Both variables should be numerical. cars is r = -0.69. The amount of ice cream in a sundae and the total grams of fat are highly Correlation should depend on units. correlated (r = 1.15). The correlation between total daily snowfall in inches and daily low temperatures Both variables should be numerical. in degrees Fahrenheit differs from the correlation between daily snowfall in inches and daily low temperatures in degrees Celsius. Answer Bank One of the variables should be categorical. Correlation should not depend on units. Correlation should depend on units. Correlation should be greater than 0. Both variables should be numerical.…arrow_forwardsolve last questionarrow_forwardDetermine the type of direction of correlation that you would expect of the given case / situation. Speed of wind turbines and amount of electricity generated. no correlation positive correlation zero correlation negative correlationarrow_forward
arrow_back_ios
SEE MORE QUESTIONS
arrow_forward_ios
Recommended textbooks for you
- MATLAB: An Introduction with ApplicationsStatisticsISBN:9781119256830Author:Amos GilatPublisher:John Wiley & Sons IncProbability and Statistics for Engineering and th...StatisticsISBN:9781305251809Author:Jay L. DevorePublisher:Cengage LearningStatistics for The Behavioral Sciences (MindTap C...StatisticsISBN:9781305504912Author:Frederick J Gravetter, Larry B. WallnauPublisher:Cengage Learning
- Elementary Statistics: Picturing the World (7th E...StatisticsISBN:9780134683416Author:Ron Larson, Betsy FarberPublisher:PEARSONThe Basic Practice of StatisticsStatisticsISBN:9781319042578Author:David S. Moore, William I. Notz, Michael A. FlignerPublisher:W. H. FreemanIntroduction to the Practice of StatisticsStatisticsISBN:9781319013387Author:David S. Moore, George P. McCabe, Bruce A. CraigPublisher:W. H. Freeman

MATLAB: An Introduction with Applications
Statistics
ISBN:9781119256830
Author:Amos Gilat
Publisher:John Wiley & Sons Inc

Probability and Statistics for Engineering and th...
Statistics
ISBN:9781305251809
Author:Jay L. Devore
Publisher:Cengage Learning

Statistics for The Behavioral Sciences (MindTap C...
Statistics
ISBN:9781305504912
Author:Frederick J Gravetter, Larry B. Wallnau
Publisher:Cengage Learning

Elementary Statistics: Picturing the World (7th E...
Statistics
ISBN:9780134683416
Author:Ron Larson, Betsy Farber
Publisher:PEARSON

The Basic Practice of Statistics
Statistics
ISBN:9781319042578
Author:David S. Moore, William I. Notz, Michael A. Fligner
Publisher:W. H. Freeman

Introduction to the Practice of Statistics
Statistics
ISBN:9781319013387
Author:David S. Moore, George P. McCabe, Bruce A. Craig
Publisher:W. H. Freeman