Using a 1-7 Likert scale, a researcher measured respondents desirabity towards cars, and he hypothesized that the respondents rated 4 out of 7 in their desirability towards 2 seat runabout sport electric vehicle. Referring to the SPSS output which of the statements is/are correct? One-Sample Statistics N Mean Std. Deviation Std. Error Mean Desirability: Seat Runabout 1.537 .049 1000 3.92 Sport Electric One-Sample Test Test Value 4 95% Confidence Interval of the Difference Mean Lower Upper
Using a 1-7 Likert scale, a researcher measured respondents desirabity towards cars, and he hypothesized that the respondents rated 4 out of 7 in their desirability towards 2 seat runabout sport electric vehicle. Referring to the SPSS output which of the statements is/are correct? One-Sample Statistics N Mean Std. Deviation Std. Error Mean Desirability: Seat Runabout 1.537 .049 1000 3.92 Sport Electric One-Sample Test Test Value 4 95% Confidence Interval of the Difference Mean Lower Upper

Glencoe Algebra 1, Student Edition, 9780079039897, 0079039898, 2018
18th Edition
ISBN:9780079039897
Author:Carter
Publisher:Carter
Chapter10: Statistics
Section10.4: Distributions Of Data
Problem 19PFA

Related questions
Topic Video
Question
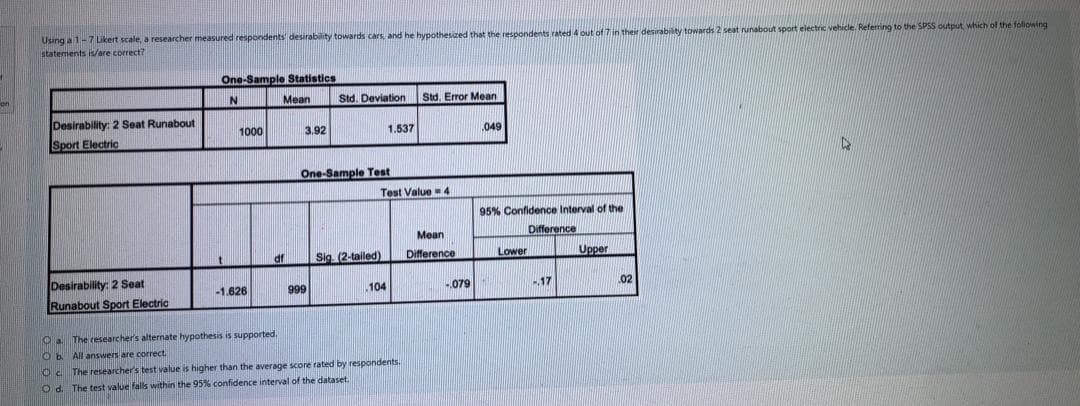
Transcribed Image Text:Using a 1-7ikert scale, a researcher measured respondents desirability towards cars, and he hypothesized that the respondents rated 4 out of 7 in their desirability towards 2 seat runabout sport electric vehicle. Referring to the SPSS output which of the foliowing
statements /are correct?
One-Sample Statistics
Mean
Std. Deviation
Std. Error Mean
Desirability: 2 Seat Runabout
Sport Electric
1000
3.92
1.537
.049
One-Sample Test
Test Value 4
95% Confidence Interval of the
Mean
Difference
Sig (2-tailed)
Difference
Lower
Upper
Desirability: 2 Seat
Runabout Sport Electric
-1.626
999
.104
-.079
17
02
The researcher's alternate hypothesis is supported
O b All answers are correct
Oc The researcher's test value is higher than the average score rated by respondents.
O d. The test value falls within the 95% confidence interval of the dataset.
Expert Solution
This question has been solved!
Explore an expertly crafted, step-by-step solution for a thorough understanding of key concepts.

Step by step
Solved in 2 steps

Knowledge Booster


Learn more about
Need a deep-dive on the concept behind this application? Look no further. Learn more about this topic, statistics and related others by exploring similar questions and additional content below.Recommended textbooks for you
Glencoe Algebra 1, Student Edition, 9780079039897…
Algebra
ISBN:
9780079039897
Author:
Carter
Publisher:
McGraw Hill
Glencoe Algebra 1, Student Edition, 9780079039897…
Algebra
ISBN:
9780079039897
Author:
Carter
Publisher:
McGraw Hill