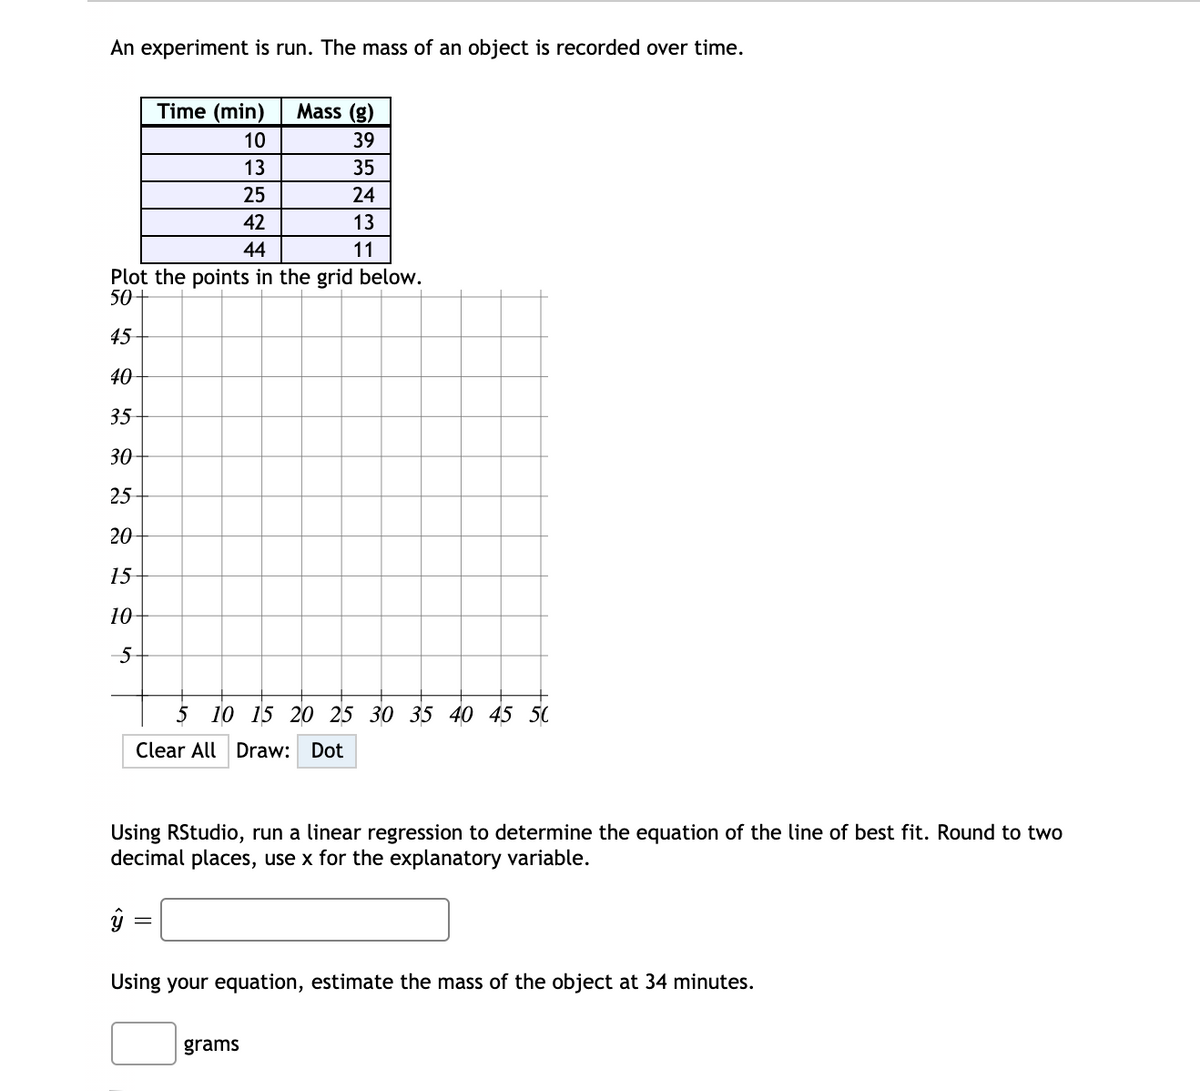
Using RStudio, run a linear regression to determine the equation of the line of best fit. Round to two decimal places, use x for the explanatory variable. Using your equation, estimate the mass of the object at 34 minutes. grams


Contingency Table
A contingency table can be defined as the visual representation of the relationship between two or more categorical variables that can be evaluated and registered. It is a categorical version of the scatterplot, which is used to investigate the linear relationship between two variables. A contingency table is indeed a type of frequency distribution table that displays two variables at the same time.
Binomial Distribution
Binomial is an algebraic expression of the sum or the difference of two terms. Before knowing about binomial distribution, we must know about the binomial theorem.
1. Can you please help me with theese questions. Thank you in advance.
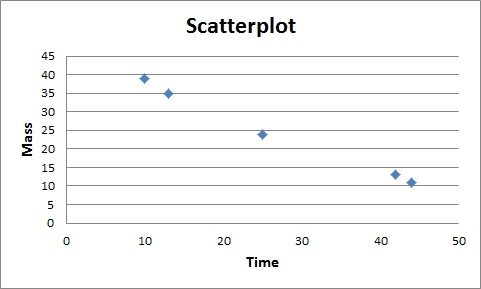
The scatter plot is obtained using EXCEL. The software procedure is given below:
- Enter the data.
- Select Insert > Charts > Scatter > Scatter with only Markers.
The output using EXCEL is as follows:

Trending now
This is a popular solution!

Step by step
Solved in 2 steps with 2 images


