Using the accompanying Home Market Value data, develop a multiple linear regression model for estimating the market value as a function of both the age and size of the house. State the model and explain R, Significance F, and p-values, with an alpha of 0.05. E Click the icon to view the Home Market Value data.
Using the accompanying Home Market Value data, develop a multiple linear regression model for estimating the market value as a function of both the age and size of the house. State the model and explain R, Significance F, and p-values, with an alpha of 0.05. E Click the icon to view the Home Market Value data.

College Algebra
7th Edition
ISBN:9781305115545
Author:James Stewart, Lothar Redlin, Saleem Watson
Publisher:James Stewart, Lothar Redlin, Saleem Watson
Chapter1: Equations And Graphs
Section: Chapter Questions
Problem 10T: Olympic Pole Vault The graph in Figure 7 indicates that in recent years the winning Olympic men’s...

Related questions
Question
100%
I need help finding the age p value
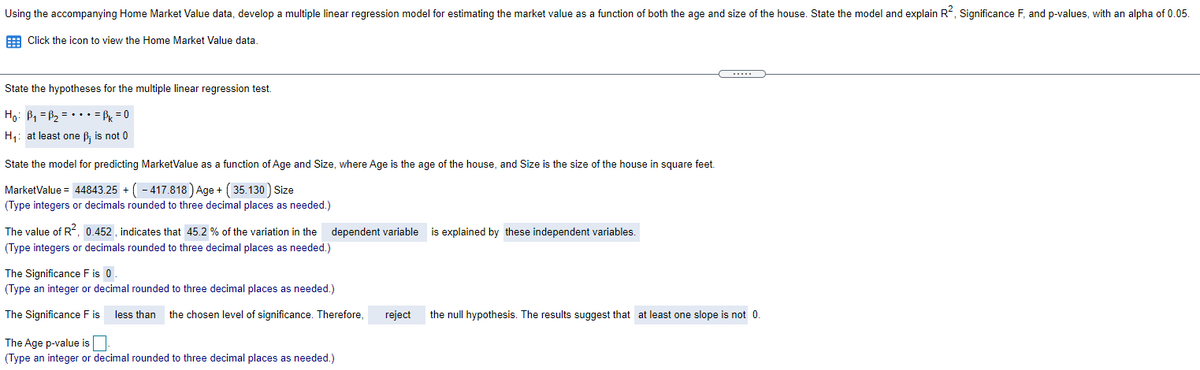
Transcribed Image Text:Using the accompanying Home Market Value data, develop a multiple linear regression model for estimating the market value as a function of both the age and size of the house. State the model and explain R?, Significance F, and p-values, with an alpha of 0.05.
E Click the icon to view the Home Market Value data
State the hypotheses for the multiple linear regression test.
Họ: B1 = B2 = • •• = Pk = 0
H: at least one B; is not 0
State the model for predicting MarketValue as a function of Age and Size, where Age is the age of the house, and Size is the size of the house in square feet.
MarketValue = 44843.25 + (- 417.818) Age + (35.130) Size
(Type integers or decimals rounded to three decimal places as needed.)
The value of R2, 0.452 , indicates that 45.2 % of the variation in the dependent variable
(Type integers or decimals rounded to three decimal places as needed.)
is explained by these independent variables.
The Significance F is 0
(Type an integer or decimal rounded to three decimal places as needed.)
The Significance F is
less than
the chosen level of significance. Therefore,
reject
the null hypothesis. The results suggest that at least one slope is not 0.
The Age p-value is
(Type an integer or decimal rounded to three decimal places as needed.)
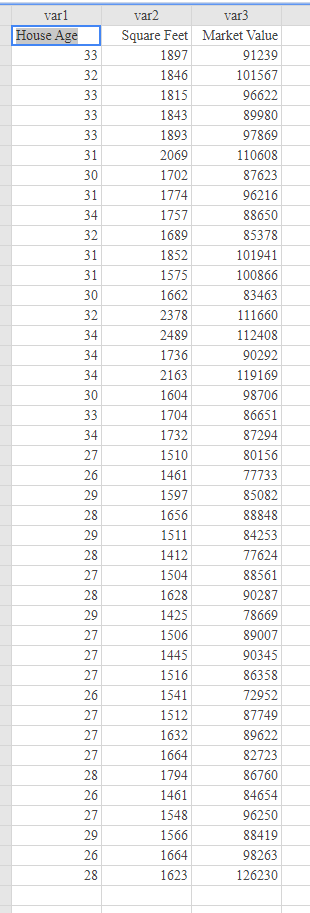
Transcribed Image Text:varl
var2
var3
House Age
Square Feet Market Value
33
1897
91239
32
1846
101567
33
1815
96622
33
1843
89980
33
1893
97869
31
2069
110608
30
1702
87623
31
1774
96216
34
1757
88650
32
1689
85378
31
1852
101941
31
1575
100866
30
1662
83463
32
2378
111660
34
2489
112408
34
1736
90292
34
2163
119169
30
1604
98706
33
1704
86651
34
1732
87294
27
1510
80156
26
1461
77733
29
1597
85082
28
1656
88848
29
1511
84253
28
1412
77624
27
1504
88561
28
1628
90287
29
1425
78669
27
1506
89007
27
1445
90345
27
1516
86358
26
1541
72952
27
1512
87749
27
1632
89622
27
1664
82723
28
1794
86760
26
1461
84654
27
1548
96250
29
1566
88419
26
1664
98263
28
1623
126230
Expert Solution
This question has been solved!
Explore an expertly crafted, step-by-step solution for a thorough understanding of key concepts.

This is a popular solution!

Trending now
This is a popular solution!

Step by step
Solved in 3 steps with 1 images

Recommended textbooks for you
College Algebra
Algebra
ISBN:
9781305115545
Author:
James Stewart, Lothar Redlin, Saleem Watson
Publisher:
Cengage Learning

Functions and Change: A Modeling Approach to Coll…
Algebra
ISBN:
9781337111348
Author:
Bruce Crauder, Benny Evans, Alan Noell
Publisher:
Cengage Learning

Glencoe Algebra 1, Student Edition, 9780079039897…
Algebra
ISBN:
9780079039897
Author:
Carter
Publisher:
McGraw Hill
College Algebra
Algebra
ISBN:
9781305115545
Author:
James Stewart, Lothar Redlin, Saleem Watson
Publisher:
Cengage Learning
Functions and Change: A Modeling Approach to Coll…
Algebra
ISBN:
9781337111348
Author:
Bruce Crauder, Benny Evans, Alan Noell
Publisher:
Cengage Learning
Glencoe Algebra 1, Student Edition, 9780079039897…
Algebra
ISBN:
9780079039897
Author:
Carter
Publisher:
McGraw Hill