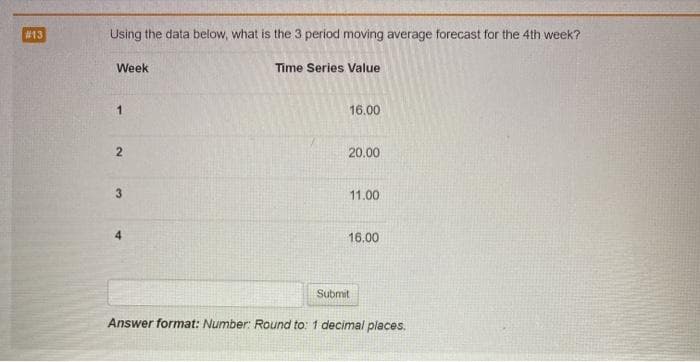
Using the data below, what is the 3 period moving average forecast for the 4th week? Week Time Series Value 16.00 20.00 3. 11.00 16.00
Q: daily high temperature (in 0F) recorded at the Mount Washington Observatory in New Hampshire for the…
A: We have given that data I want to find mean and standard deviation. Mean = sum of all…
Q: (a) Determine the mean = (b) Determine the Standard Deviation (c) Determine the Coefficiet of…
A: here given , A concerned parents group determined the number of commercials shows in each of the…
Q: The population parameters below describe the full-time equivalent number of students (FTES) each…
A:
Q: The figure below illustrating chemical process concentration readings made every hour. The minimum…
A: Explanation: From the time-series plot, it is clear that there is no specific pattern in the…
Q: **. e20. Find Geometric mean for the following data: 10, 110, 135, 120, 50, 59, 60, 7
A: Given data is10,110,135,120,50,59,60,7
Q: Find the mean, standard deviation, and standard error of the mean for the following data set of…
A: Given data: 52,54,51,55,52 n = 5
Q: Approximate the measures of center for following GFDT. Data Frequency 70 - 74 1 75 - 79 80 - 84 10…
A: Mode: For a frequency distribution, mode is defined as the value with highest frequency, Median: For…
Q: Male and female populations of humpback whales under 80 years old are represented by age in the…
A:
Q: Using the data below, what is the value of the absolute percent error for week 3? WeekTime Series…
A:
Q: Campus Advising needs to allocate time this week for office appointments, so she needs to forecast…
A:
Q: Find the range and standard deviation.The table below gives the number of hours spent watching TV…
A: In the sample data set of 24 children, the maximum number of hours spent watching TV last week is 10…
Q: A marketing research company records the consumer habits of a sample of 24 families from a certain…
A: A marketing research company records the consumer habits of a sample of 24 families from a certain…
Q: A police station had to deploy a police officer for an emergency multiple times in the last four…
A: The moving average method is to be used to find the forecast for Friday, using the information in…
Q: Net working capital 400 Debt 1000 Net Fixed assets 1600 Equity 1000 Total assets…
A:
Q: Male and female populations of elephants under 80 years old are represented by age in the table…
A: Given data: To find: (a) Approximate the population mean and standard deviation of age for males.
Q: Using this table, solve for the population mean, population standard deviation and median. (use 4…
A: Concentration of all the values around the central value of the given data is known as measures of…
Q: Terms Description Function 1. Mean 2. Percentage 3. Standard Deviation 4. Frequency 5. Correlation
A: Since you have posted multiple sub-parts, we will solve the first three sub-parts for you. To get…
Q: Eorm the data given below calculate the Co-efficient of variation Pearson's measure of skewness 86.…
A: Answer:
Q: Approximate the mean of the frequency distribution for the ages of the residents of a town. The…
A:
Q: Interpolation and extrapolation Estimate the production for the year 2005 with the help of the…
A:
Q: Global Warming Listed below are mean annual temperatures (°C) of the earth for each decade,…
A: Enter the given data in excel as shown below
Q: Find the standard deviation and uncertainty of the following data.
A: to find uncertainty and standard deviation
Q: Use the frequency distribution to construct a histogram. Does the histogram appear to depict data…
A: Use the frequency distribution to construct a histogram. Weight (g) Frequency 6.000-6.049 3…
Q: 6. Grade point averages (GP AS) are computed as weighted averages in which each course grade is…
A: From given, calculate as follows
Q: Yhe following data relate to the age of a group of Govt. employees Calculate the arithmetic mean and…
A:
Q: Time Series Week Value 1 11 16 3 15 4 14 15 6 14 7 16 8 17 15 10 13
A: Mean of absolute percentage error: M=1n∑t=1n At-FtAt Mean of Absolute Value of forecast error:…
Q: Interpret this trend using the descriptive statistics
A: Histogram - It is the graphical representation of data, It is same as frequency table, but it can…
Q: a) Find mean age of participants. b) Find median age of participants. c) What is the mode?
A: Mean is the average value . Median is defined as the that value of the variable below which lies…
Q: Identify which level of measurement is represented by the following data: 1. Years covered in…
A: Interval data: It is a continuous variable that takes the numerical values within the range of…
Q: Approximate the mean of the frequency distribution for the ages of the residents The approximate…
A: It is an important part of statistics . It is widely used in all forms of statistical applications .
Q: The approximate mean age is years. (Round to one decimal place as needed.) Approximate the mean of…
A:
Q: The table in the picture shows measured values of particles in the air at a measuring station in…
A: Given data
Q: Carbon Dioxide Listed below are mean amounts of carbon dioxide concentrations (parts per million) in…
A: In this case, need to plot the scatterplot for linear, quadratic, logarithmic, exponential, and…
Q: The number of cans of soft drinks sold in a machine each week is recorded below. Develop forecasts…
A: Data is given for sale of each week for cans of softdrinks We have to calculate mean squared error…
Q: Using the data below, what is the value of the Mean absolute percent error Week Time Series Value…
A: Given information: time series value forecast 17 4 25 19 14 16 23 12 Formula:…
Q: experiment in the coming year on a 10 acre large plot s similar because the water and minerals are…
A: Given:
Q: What is the model for the trendline? Final Exam Grade = x Midterm Grade (Round to three decimal…
A: The scatterplot and regression line is obtained by using EXCEL. The software procedure is given…
Q: According to a government energy agency, the mean monthly household electricity bill in the United…
A: Given, μ=110.10 σ=18 Normally distributed:z=x-μσ
Q: The number of cans of soft drinks sold in a machine each week is recorded below. Develop forecasts…
A: Given Sales of cans of softdrinks for week We have to calculate forcast for week 10 and mean…
Q: Hampshire for the first 15 days of February 2021. Use the given data to answer questions 1 - 8.…
A: We have given that data I want to find Q1 and Q3 Formula for Range Range = max - min Note:-…
Q: Categorize the following variables as being qualitative or quantitative: Rating of the quality of a…
A: Determine whether the given statement indicates the quantitative or qualitative variable. The…
Q: Real wage is a wage deflated by the current consumer price index. It gives information on how much…
A: Obtain the value of mean nominal wage. The value of mean nominal wage is obtained below as…
Q: Weight(lbs) Number of Bicycles Midpoint Relative Frequency Cumulative Frequency 16 - 20 7 18 7 21 -…
A: We have to find out relative frequency of given data..
Q: Using the table below, what is your forecast for week 11 using a three-week weighted moving average…
A: Given, The weight for the most current period =>1st month = 0.30 The weight for the oldest time…
Q: The following data shows the number of hours slept by a patient in 1 weeks 12 18 09 16 11 10 08
A: Solution-: We calculate, (a) The unbiased estimate for the population mean=? (b) The unbiased…
Q: The following are the P/E ratios (price of stock divided by projected earnings per share) for 18…
A: Calculate Percentiles-10 , Percentiles-75 from the following…
Q: Calculate the 75th percentile of the data How to find it or calculate it? x 2.1 5.9 8.8 9.6 14.1…
A:
Q: Which of the following statements is an example of a descriptive statistics? Select the correct…
A: Option 2 in both MCQ are presenting the descriptive statistics.
Q: The population of an island has increased over the past 30 years, and is expected to continue to…
A:
Q: The number of cans of soft drinks sold in a machine each week is recorded below. Develop forecasts…
A: Introduction: It is required to use exponential smoothing for forecasting, and obtain the mean…
Help me fast so that I will give Upvote.
Trending now
This is a popular solution!
Step by step
Solved in 2 steps
- The US. import of wine (in hectoliters) for several years is given in Table 5. Determine whether the trend appearslinear. Ifso, and assuming the trend continues, in what year will imports exceed 12,000 hectoliters?Using the data in Table 1 at the beginning of this section, find the average rate of change between 2005 and 2010.Table 6 shows the population, in thousands, of harbor seals in the Wadden Sea over the years 1997 to 2012. a. Let x represent time in years starting with x=0 for the year 1997. Let y represent the number of seals in thousands. Use logistic regression to fit a model to these data. b. Use the model to predict the seal population for the year 2020. c. To the nearest whole number, what is the limiting value of this model?
- Use the table of values you made in part 4 of the example to find the limiting value of the average rate of change in velocity.Determine: a) chain absolute increase for July: b) base relative increase for August: c) base dynamics index for October: Geometric mean calculated from equals 1.02, which means that:The forecast for year 6 using a weighted 2-year moving average with weights of 0.350.35 and 0.650.65 (the weight of 0.650.65 is for the most recent period) is what?
- The MAD for the forecast developed using a weighted 2-year moving average with weights of 0.350.35 and 0.650.65 is what?The following table represents the MPY closing sock price over a period of 9 trading days. In the image. What is the 2nd 6-day simple moving average? Round your answer to nearest penny.The figure below illustrates monthly data over 10 years. What method would you expect would perform the best at forecasting the data series in period 121? Explain the (i) strengths of your selected method for this data and the (ii) weaknesses of alternative methods for this data. Consider the concepts of level, seasonality, trend, and noise in your answer.
- A mutual fund achieved the following rates of growth over an 11-month period: 3% 2% 7% 8% 2% 4% 3% 7.5% 7.2% 2.7% 2.09% Determine the 5th decile from the data. a. 7% b. 4% c. 3% d. 2%Third Attempt at this question. (a) Make a line chart and fit an m-period moving average to the exchange rate data shown above with m = 2, 3, 4, and 5 periods. For each method, state the last MA value. (Round your answers to 4 decimal places.) m-period Next period forecast 2 1.8604 1.8604 Incorrect 3 1.93849 1.93849 Incorrect 4 2.01048 2.01048 Incorrect 5 2.07638 2.07638 Incorrect This question was asked previously and i was given the wrong answers. 1.82440, 1.82803,1.83495,1.83300 are all incorrect. Daily Spot Exchange Rate, U.S. Dollars per Pound Sterling t Date Rate 1 1-Apr-04 1.8564 2 2-Apr-04 1.8293 3 5-Apr-04 1.8140 4 6-Apr-04 1.8374 5 7-Apr-04 1.8410 6 8-Apr-04 1.8325 7 9-Apr-04 1.8322 8 12-Apr-04 1.8358 9 13-Apr-04 1.8160…Please answer the following questions using the images provided for data in the images. 1. Which of the following time periods will have the largest annual average increase in the percentage of jobs that could be fully automated (based on the provided images attached)? A) 2020-2028 B) 2028-2030 C) 2030-2035 D) 2035-2040 E) 2040-2050 2. What is the ratio of the total jobs at risk in Transportation and Storage to those at riks in Retail? A) 4.68:7.79 B) 7.79:4.68 C) 52:41 D) 9:19 E) 30:27 3. Salaries in Finance and Insurance are twice as much as the average salary. What is the total amount spent on Finance and Insurance salaries in Switzerland per year (based only on the provided information and images)? 4. What timescale is the title of the grapth (image attached) most likely to be referring to when it says the future? A) 2080 B) 2050 C) 2030 D) 2028 E) 2020 5. Which of the following is the largest number of jobs that could theoretically be within the software industry at…