Using the table below, what is your forecast for week 11 using a three-week weighted moving average with weights of 0.30 for the most current time period and 0.2 for the oldest time period? Week Sales 1 110 115
Using the table below, what is your forecast for week 11 using a three-week weighted moving average with weights of 0.30 for the most current time period and 0.2 for the oldest time period? Week Sales 1 110 115

College Algebra (MindTap Course List)
12th Edition
ISBN:9781305652231
Author:R. David Gustafson, Jeff Hughes
Publisher:R. David Gustafson, Jeff Hughes
Chapter4: Polynomial And Rational Functions
Section4.6: Rational Functions
Problem 11SC: Find the mean hourly cost when the cell phone described above is used for 240 minutes.

Related questions
Question
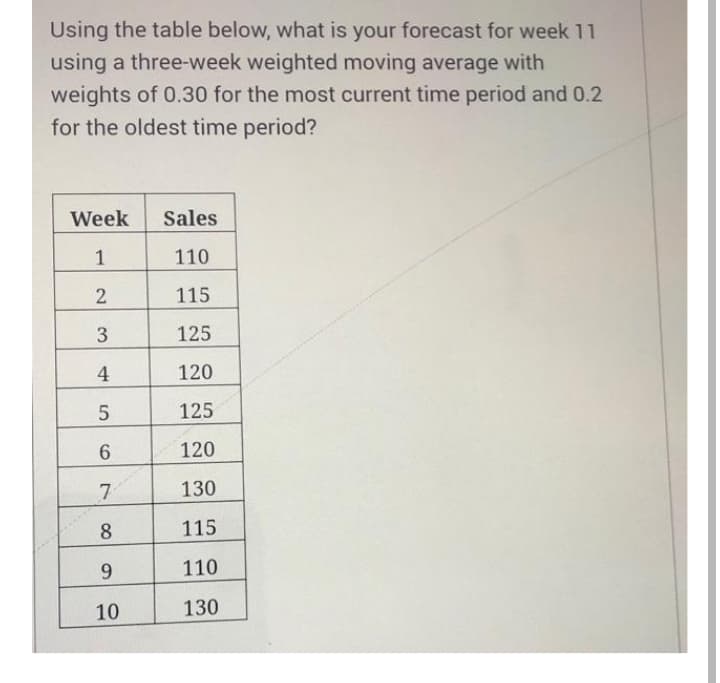
Transcribed Image Text:Using the table below, what is your forecast for week 11
using a three-week weighted moving average with
weights of 0.30 for the most current time period and 0.2
for the oldest time period?
Week
Sales
1
110
115
125
4
120
5
125
120
7
130
8.
115
9.
110
10
130
2.
Expert Solution
This question has been solved!
Explore an expertly crafted, step-by-step solution for a thorough understanding of key concepts.

This is a popular solution!

Trending now
This is a popular solution!

Step by step
Solved in 2 steps

Knowledge Booster


Learn more about
Need a deep-dive on the concept behind this application? Look no further. Learn more about this topic, statistics and related others by exploring similar questions and additional content below.Recommended textbooks for you
College Algebra (MindTap Course List)
Algebra
ISBN:
9781305652231
Author:
R. David Gustafson, Jeff Hughes
Publisher:
Cengage Learning

Glencoe Algebra 1, Student Edition, 9780079039897…
Algebra
ISBN:
9780079039897
Author:
Carter
Publisher:
McGraw Hill
College Algebra (MindTap Course List)
Algebra
ISBN:
9781305652231
Author:
R. David Gustafson, Jeff Hughes
Publisher:
Cengage Learning
Glencoe Algebra 1, Student Edition, 9780079039897…
Algebra
ISBN:
9780079039897
Author:
Carter
Publisher:
McGraw Hill