Using the data in the table below, estimate the demand function for cod. Price, dollars per pound 1.90 1.35 1.25 Quantity, thousand pounds per day Q=12.53-6.25p. Suppose the quantity in the first row of the table were 2.5 instead of 1.5. The linear demand function would now be 1.5 524950% Suppose the quantity in the second row of the table were 2.7 instead of 2.2 The linear demand function would now be 2.2 4.4 5.9 6.5 ܢܬ 1.20 0.95 0.85 0.73 Using the Excel trendline option to estimate a linear demand function, the linear demand function is 7.0 8.8 Q= 11.75 5.46 p. (Enter your responses rounded to two decimal places) Q= -- (Enter your responses rounded to two decimal places)
Using the data in the table below, estimate the demand function for cod. Price, dollars per pound 1.90 1.35 1.25 Quantity, thousand pounds per day Q=12.53-6.25p. Suppose the quantity in the first row of the table were 2.5 instead of 1.5. The linear demand function would now be 1.5 524950% Suppose the quantity in the second row of the table were 2.7 instead of 2.2 The linear demand function would now be 2.2 4.4 5.9 6.5 ܢܬ 1.20 0.95 0.85 0.73 Using the Excel trendline option to estimate a linear demand function, the linear demand function is 7.0 8.8 Q= 11.75 5.46 p. (Enter your responses rounded to two decimal places) Q= -- (Enter your responses rounded to two decimal places)

Chapter5: Elasticity Of Demand And Supply
Section: Chapter Questions
Problem 1.1P: (Calculating Price Elasticity of Demand) Suppose that 50 units of a good are demanded at a price of...

Related questions
Question
economics
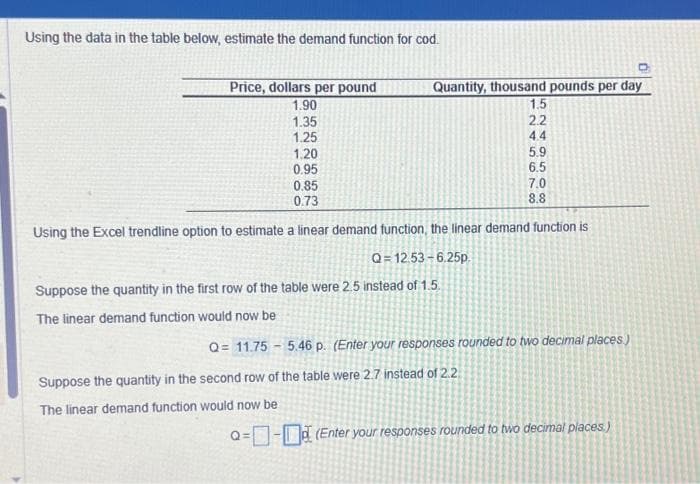
Transcribed Image Text:Using the data in the table below, estimate the demand function for cod.
Price, dollars per pound
1.90
1.35
1.25
1.20
0.95
Quantity, thousand pounds per day
1.5
Q=12.53-6.25p.
Suppose the quantity in the first row of the table were 2.5 instead of 1.5.
The linear demand function would now be
245678
ANAS508
2.2
Suppose the quantity in the second row of the table were 2.7 instead of 2.2
The linear demand function would now be
44
5.9
6.5
0.85
0.73
8.8
Using the Excel trendline option to estimate a linear demand function, the linear demand function is
7.0
Q= 11.75 5.46 p. (Enter your responses rounded to two decimal places)
Q=- (Enter your responses rounded to two decimal places.)
Expert Solution
This question has been solved!
Explore an expertly crafted, step-by-step solution for a thorough understanding of key concepts.

This is a popular solution!

Trending now
This is a popular solution!

Step by step
Solved in 5 steps with 1 images

Knowledge Booster


Learn more about
Need a deep-dive on the concept behind this application? Look no further. Learn more about this topic, economics and related others by exploring similar questions and additional content below.Recommended textbooks for you

Managerial Economics: Applications, Strategies an…
Economics
ISBN:
9781305506381
Author:
James R. McGuigan, R. Charles Moyer, Frederick H.deB. Harris
Publisher:
Cengage Learning

Managerial Economics: Applications, Strategies an…
Economics
ISBN:
9781305506381
Author:
James R. McGuigan, R. Charles Moyer, Frederick H.deB. Harris
Publisher:
Cengage Learning


