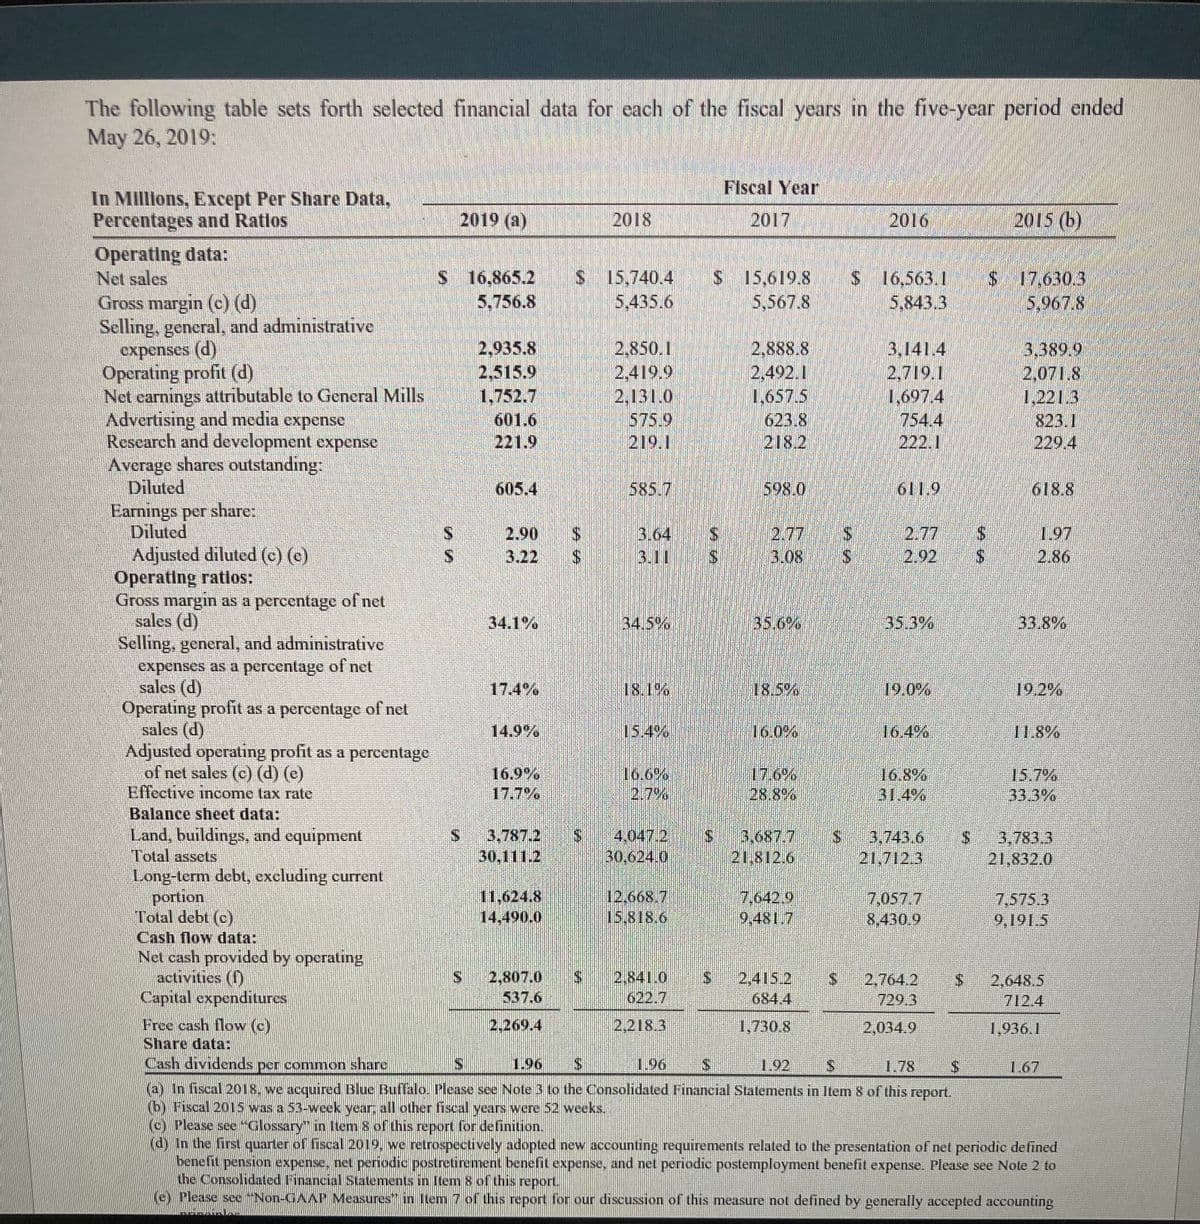
Using the fiscal year end 2020 annual report for General Mills, Inc. and the figures from the 2020 annual report as noted below, calculate the financial ratios for 2020 and 2019 indicated using the EXCEL template provided: 1. The average collection period 2.Days sales in inventory 3. debt to equity ratio 4. Times interest earned 5. Operating cash flow to Capital expenditures ratio 6. Earnings per share 7. Price earnings ratio 8. Dividend yield 9. Dividend payout ratio 10. Total assets 2020 = $30,806.7 Total stockholders’ equity 2020 = $8,349.5 Total current liabilities 2020 = $7,491.5 Accounts receivable 2020 = $1,615.1 Inventory 2020 = $1,426.3 Year-end closing stock price May 2020 = $58.80 Year-end closing stock price May 2019 = $53.56
Using the fiscal year end 2020 annual report for General Mills, Inc. and the figures from the 2020 annual report as noted below, calculate the financial ratios for 2020 and 2019 indicated using the EXCEL template provided: 1. The average collection period 2.Days sales in inventory 3. debt to equity ratio 4. Times interest earned 5. Operating cash flow to Capital expenditures ratio 6. Earnings per share 7. Price earnings ratio 8. Dividend yield 9. Dividend payout ratio 10. Total assets 2020 = $30,806.7 Total stockholders’ equity 2020 = $8,349.5 Total current liabilities 2020 = $7,491.5 Accounts receivable 2020 = $1,615.1 Inventory 2020 = $1,426.3 Year-end closing stock price May 2020 = $58.80 Year-end closing stock price May 2019 = $53.56
Using the fiscal year end 2020 annual report for General Mills, Inc. and the figures from the 2020 annual report as noted below, calculate the financial ratios for 2020 and 2019 indicated using the EXCEL template provided: 1. The average collection period 2.Days sales in inventory 3. debt to equity ratio 4. Times interest earned 5. Operating cash flow to Capital expenditures ratio 6. Earnings per share 7. Price earnings ratio 8. Dividend yield 9. Dividend payout ratio 10. Total assets 2020 = $30,806.7 Total stockholders’ equity 2020 = $8,349.5 Total current liabilities 2020 = $7,491.5 Accounts receivable 2020 = $1,615.1 Inventory 2020 = $1,426.3 Year-end closing stock price May 2020 = $58.80 Year-end closing stock price May 2019 = $53.56
Using the fiscal year end 2020 annual report for General Mills, Inc. and the figures from the 2020 annual report as noted below, calculate the financial ratios for 2020 and 2019 indicated using the EXCEL template provided: 1. The average collection period
2.Days sales in inventory
3. debt to equity ratio
4. Times interest earned
5. Operating cash flow to Capital expenditures ratio
6. Earnings per share
7. Price earnings ratio
8. Dividend yield
9. Dividend payout ratio
10.
Total assets 2020 = $30,806.7 Total stockholders’ equity 2020 = $8,349.5 Total current liabilities 2020 = $7,491.5 Accounts receivable 2020 = $1,615.1 Inventory 2020 = $1,426.3 Year-end closing stock price May 2020 = $58.80 Year-end closing stock price May 2019 = $53.56
Transcribed Image Text:The following table sets forth selected financial data for each of the fiscal years in the five-year period ended
May 26, 2019:
Flscal Year
In MIlllons, Except Per Share Data,
Percentages and Ratlos
2019 (a)
2018
2017
2016
2015 (b)
Operating data:
Net sales
Gross margin (c) (d)
Selling, general, and administrative
expenses (d)
Operating profit (d)
Net earnings attributable to General Mills
Advertising and media expense
Research and development expense
Average shares outstanding:
Diluted
Earnings per share:
Diluted
Adjusted diluted (c) (c)
Operating ratlos:
Gross margin as a percentage of net
sales (d)
Selling, general, and administrative
expenses as a percentage of net
sales (d)
Operating profit as a percentage of net
sales (d)
Adjusted operating profit as a percentage
of net sales (c) (d) (e)
Effective income tax rate
S 16,865.2
5,756.8
S 15,740.4 S 15,619.8
5,435.6
S 16,563.1 $ 17,630.3
5,843.3
5,567.8
5,967.8
2,935.8
2,515.9
1,752.7
601.6
221.9
2,850.1
2,419.9
2,131.0
575.9
219.1
2,888.8
2,492.1
1,657.5
623.8
218.2
3,141.4
2,719.1
1,697.4
754.4
222.1
3,389.9
2,071.8
1,221.3
823.1
229.4
605.4
585.7
598.0
611.9
618.8
|S 2.77
3.64 S
3.11 S
1.97
2.86
2.90
2.77
3.22
3.08 S 2.92
34.1%
34.5%
35.6%
35.3%
33.8%
17.4%
18.1%
18.5%
19.0%
19.2%
14.9%
15.4%
16.0%
16.4%
11.8%
16.9%
17.7%
16.6%
2.7%
17.6%
28.8%
16.8%
31.4%
15.7%
33.3%
Balance sheet data:
Land, buildings, and equipment
Total assets
Long-term debt, excluding current
portion
Total debt (c)
3,787.2
30,111.2
4,047.2
30,624.0
3,687.7
21,812.6
3.743.6
21,712.3
3,783.3
21,832.0
11,624.8
14,490.0
12,668.7
15,818.6
7.642.9
9,481.7
7,057.7
8,430.9
7,575.3
9,191.5
Cash flow data:
Net cash provided by operating
activities (f)
Capital expenditures
2,807.0
537.6
2,841.0
622.7
2,415.2
684.4
S.
2,764.2
729.3
2,648.5
712.4
Free cash flow (c)
Share data:
Cash dividends per common share
2,269.4
2,218.3
1,730.8
2,034.9
1,936.1
1.96
1.96
S 1.92
1.78
1.67
(a) In fiscal 2018, we acquired Blue Buffalo. Please see Note 3 to the Consolidated Financial Statements in Item 8 of this report.
(b) Fiscal 2015 was a 53-week year; all other fiscal years were 52 weeks.
(c) Please see "Glossary" in Item 8 of this report for definition.
(d) In the first quarter of fiscal 2019, we retrospectively adopted new accounting requirements related to the presentation of net periodic defined
benefit pension expense, net periodic postretirement benefit expense, and net periodic postemployment benefit expense. Please see Note 2 to
the Consolidated Financial Statements in Item 8 of this report.
(e) Please see "Non-GAAP Measures" in Item 7 of this report for our discussion of this measure not defined by generally accepted accounting
%24
%24
Definition Definition Assets available to stockholders after a company's liabilities are paid off. Stockholders’ equity is also sometimes referred to as owner's equity. A stockholders’ equity or book value generally includes common stock, preferred stock, and retained earnings and is an indicator of a company's financial strength.
Expert Solution
This question has been solved!
Explore an expertly crafted, step-by-step solution for a thorough understanding of key concepts.
Need a deep-dive on the concept behind this application? Look no further. Learn more about this topic, accounting and related others by exploring similar questions and additional content below.