Using the following regression table, we can see that the assumed lineas rogression is significant at 0.05 level of significance Regression Statistics Multiple R R Square Adjusted R Square Standard 2.54008 Observati 79 ANOVA Regressio Residual Total df Select one: True O False SS MS gnificance F 1 8241.992 8241.992 1277.430962 1.06E-49 77 496.8045 6.452006 78 8738.797 Coefficientandard Err t Stat P-value Lower 95%Upper 95%ower 95.0%pper 95.0% 13.2083 10.91027 13.2083 Intercept 12.05928 0.577032 20.8988 0.008080197 10.91027 0.44792 0.012532 35.74117 0.063939553 0.422965 0.472876 0.422965 0.472876
Using the following regression table, we can see that the assumed lineas rogression is significant at 0.05 level of significance Regression Statistics Multiple R R Square Adjusted R Square Standard 2.54008 Observati 79 ANOVA Regressio Residual Total df Select one: True O False SS MS gnificance F 1 8241.992 8241.992 1277.430962 1.06E-49 77 496.8045 6.452006 78 8738.797 Coefficientandard Err t Stat P-value Lower 95%Upper 95%ower 95.0%pper 95.0% 13.2083 10.91027 13.2083 Intercept 12.05928 0.577032 20.8988 0.008080197 10.91027 0.44792 0.012532 35.74117 0.063939553 0.422965 0.472876 0.422965 0.472876

Glencoe Algebra 1, Student Edition, 9780079039897, 0079039898, 2018
18th Edition
ISBN:9780079039897
Author:Carter
Publisher:Carter
Chapter10: Statistics
Section10.1: Measures Of Center
Problem 9PPS

Related questions
Question
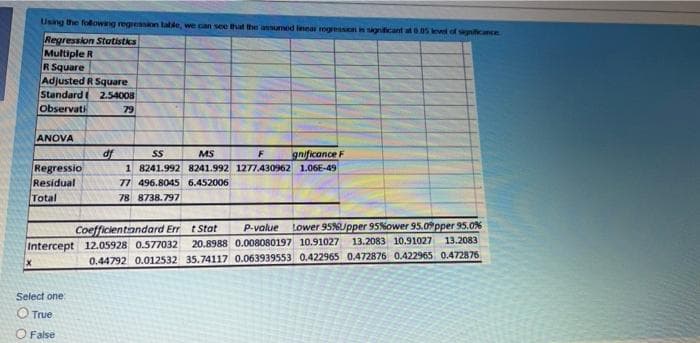
Transcribed Image Text:Using the following regression table, we can see that the assumed linear regression is significant at 0.05 level of significance
Regression Statistics
Multiple R
R Square
Adjusted R Square
Standard ( 2.54008
Observati
79
ANOVA
Regressio
Residual
Total
X
df
Select one:
O True
O False
SS
MS
F
gnificance F
1 8241.992 8241.992 1277.430962 1.06E-49
Coefficientandard Errt Stat
P-value Lower 95%Upper 95%ower 95.0%pper 95.0%
Intercept 12.05928 0.577032 20.8988 0.008080197 10.91027 13.2083 10.91027 13.2083
0.44792 0.012532 35.74117 0.063939553 0.422965 0.472876 0.422965 0.472876
77 496.8045 6.452006
78 8738.797
Expert Solution
This question has been solved!
Explore an expertly crafted, step-by-step solution for a thorough understanding of key concepts.

Step by step
Solved in 2 steps

Recommended textbooks for you
Glencoe Algebra 1, Student Edition, 9780079039897…
Algebra
ISBN:
9780079039897
Author:
Carter
Publisher:
McGraw Hill
Glencoe Algebra 1, Student Edition, 9780079039897…
Algebra
ISBN:
9780079039897
Author:
Carter
Publisher:
McGraw Hill