Using the picture for this grouped data. in km per liter The following frequency distribution was obtained. What is its variance, SD, sample skewness in + interpretation, exact and excess kurtosis of the population in + interpretation, and the sample kurtosis ?
Using the picture for this grouped data. in km per liter The following frequency distribution was obtained. What is its variance, SD, sample skewness in + interpretation, exact and excess kurtosis of the population in + interpretation, and the sample kurtosis ?

Algebra & Trigonometry with Analytic Geometry
13th Edition
ISBN:9781133382119
Author:Swokowski
Publisher:Swokowski
Chapter1: Fundamental Concepts Of Algebra
Section1.4: Fractional Expressions
Problem 7E

Related questions
Question
Using the picture for this grouped data. in km per liter The following
frequency distribution was obtained.
What is its variance, SD, sample skewness in + interpretation, exact and excess kurtosis of the population in + interpretation, and the sample
kurtosis ?
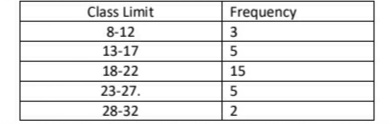
Transcribed Image Text:Class Limit
Frequency
8-12
3
13-17
5
18-22
15
23-27.
5
28-32
2
Expert Solution
This question has been solved!
Explore an expertly crafted, step-by-step solution for a thorough understanding of key concepts.

Step by step
Solved in 4 steps with 4 images

Recommended textbooks for you
Algebra & Trigonometry with Analytic Geometry
Algebra
ISBN:
9781133382119
Author:
Swokowski
Publisher:
Cengage

College Algebra (MindTap Course List)
Algebra
ISBN:
9781305652231
Author:
R. David Gustafson, Jeff Hughes
Publisher:
Cengage Learning

College Algebra
Algebra
ISBN:
9781305115545
Author:
James Stewart, Lothar Redlin, Saleem Watson
Publisher:
Cengage Learning
Algebra & Trigonometry with Analytic Geometry
Algebra
ISBN:
9781133382119
Author:
Swokowski
Publisher:
Cengage
College Algebra (MindTap Course List)
Algebra
ISBN:
9781305652231
Author:
R. David Gustafson, Jeff Hughes
Publisher:
Cengage Learning
College Algebra
Algebra
ISBN:
9781305115545
Author:
James Stewart, Lothar Redlin, Saleem Watson
Publisher:
Cengage Learning