
Chapter25: Instruments For Optical Spectrometry
Section: Chapter Questions
Problem 25.14QAP

Related questions

Question
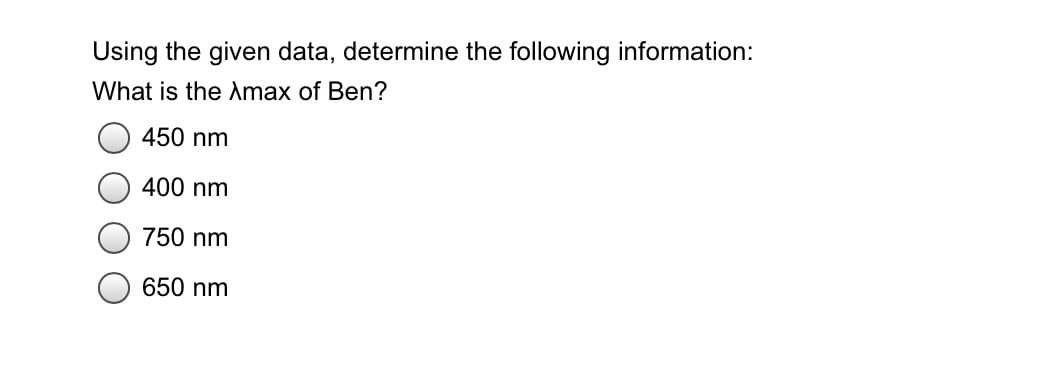
Transcribed Image Text:Using the given data, determine the following information:
What is the max of Ben?
450 nm
400 nm
750 nm
650 nm
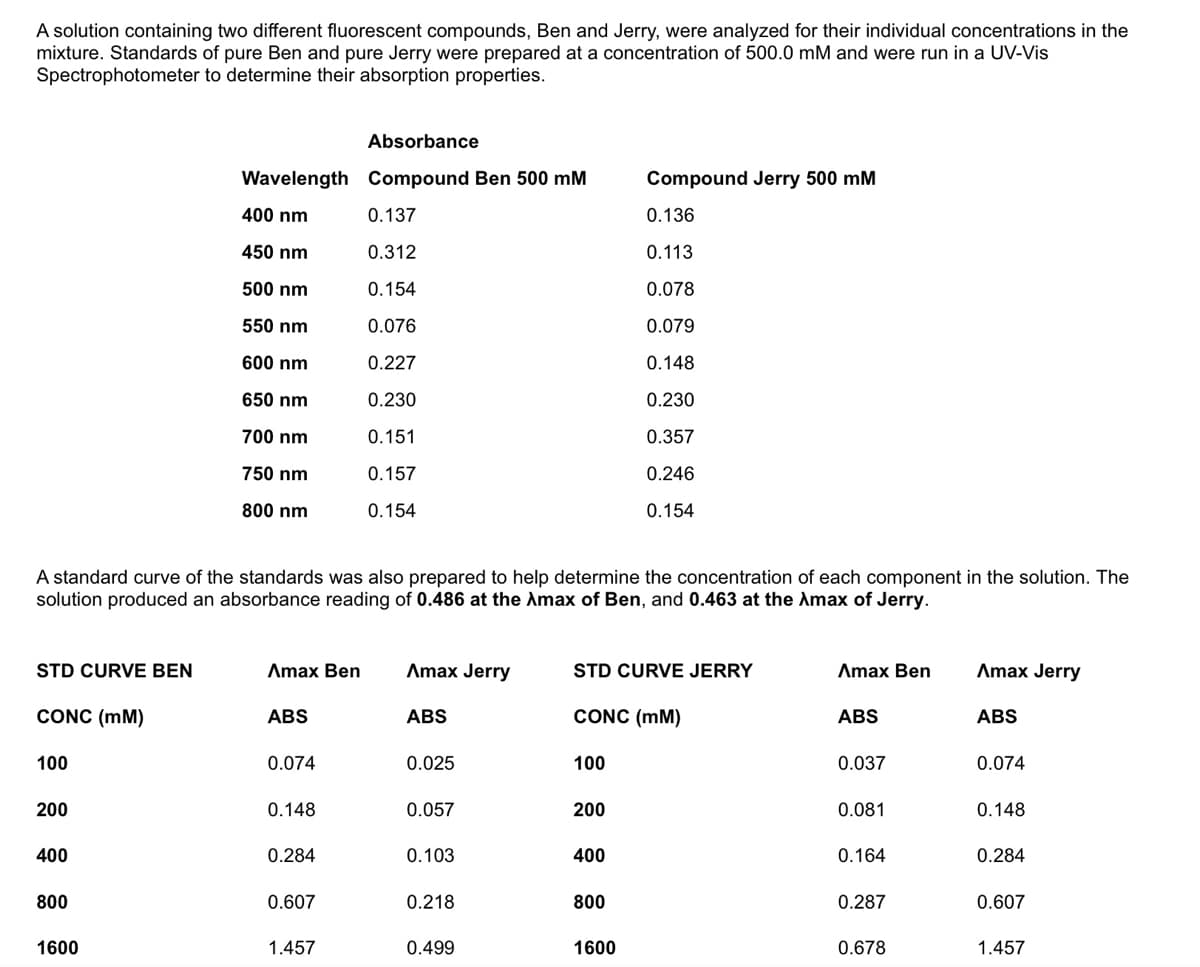
Transcribed Image Text:A solution containing two different fluorescent compounds, Ben and Jerry, were analyzed for their individual concentrations in the
mixture. Standards of pure Ben and pure Jerry were prepared at a concentration of 500.0 mM and were run in a UV-Vis
Spectrophotometer to determine their absorption properties.
Absorbance
Wavelength Compound Ben 500 mM
Compound Jerry 500 mM
400 nm
0.137
0.136
450 nm
0.312
0.113
500 nm
0.154
0.078
550 nm
0.076
0.079
600 nm
0.227
0.148
650 nm
0.230
0.230
700 nm
0.151
0.357
750 nm
0.157
0.246
800 nm
0.154
0.154
A standard curve of the standards was also prepared to help determine the concentration of each component in the solution. The
solution produced an absorbance reading of 0.486 at the Amax of Ben, and 0.463 at the Amax of Jerry.
STD CURVE BEN
Amax Ben
Amax Jerry
STD CURVE JERRY
Amax Ben
Amax Jerry
CONC (mM)
ABS
ABS
CONC (mM)
ABS
ABS
100
0.074
0.025
100
0.037
0.074
200
0.148
0.057
200
0.081
0.148
400
0.284
0.103
400
0.164
0.284
800
0.607
0.218
800
0.287
0.607
1600
1.457
0.499
1600
0.678
1.457
Expert Solution
This question has been solved!
Explore an expertly crafted, step-by-step solution for a thorough understanding of key concepts.

Step by step
Solved in 2 steps with 2 images

Knowledge Booster


Learn more about
Need a deep-dive on the concept behind this application? Look no further. Learn more about this topic, chemistry and related others by exploring similar questions and additional content below.Recommended textbooks for you

Principles of Instrumental Analysis
Chemistry
ISBN:
9781305577213
Author:
Douglas A. Skoog, F. James Holler, Stanley R. Crouch
Publisher:
Cengage Learning
Principles of Instrumental Analysis
Chemistry
ISBN:
9781305577213
Author:
Douglas A. Skoog, F. James Holler, Stanley R. Crouch
Publisher:
Cengage Learning

Chemistry & Chemical Reactivity
Chemistry
ISBN:
9781337399074
Author:
John C. Kotz, Paul M. Treichel, John Townsend, David Treichel
Publisher:
Cengage Learning

Chemistry & Chemical Reactivity
Chemistry
ISBN:
9781133949640
Author:
John C. Kotz, Paul M. Treichel, John Townsend, David Treichel
Publisher:
Cengage Learning

Principles of Modern Chemistry
Chemistry
ISBN:
9781305079113
Author:
David W. Oxtoby, H. Pat Gillis, Laurie J. Butler
Publisher:
Cengage Learning