Variance Standard Deviation 7 05 Mean = 3.75 49.75 14. What are the data values (raw scores) associated with standard scores of -1.05 and -0.05? Determine the percentage in between these scores. Draw the curve and show your complete solution. 15. What are the data values (raw scores) associated with standard scores of -0.09 and 1.15? Determine the percentage in between these scores. Draw the curve and show your complete solution. 16. What is the range (sx<) of the data values that would allow 90% of the data to fall within the mean observing symmetry? Draw the curve and show your complete solution.
Variance Standard Deviation 7 05 Mean = 3.75 49.75 14. What are the data values (raw scores) associated with standard scores of -1.05 and -0.05? Determine the percentage in between these scores. Draw the curve and show your complete solution. 15. What are the data values (raw scores) associated with standard scores of -0.09 and 1.15? Determine the percentage in between these scores. Draw the curve and show your complete solution. 16. What is the range (sx<) of the data values that would allow 90% of the data to fall within the mean observing symmetry? Draw the curve and show your complete solution.

MATLAB: An Introduction with Applications
6th Edition
ISBN:9781119256830
Author:Amos Gilat
Publisher:Amos Gilat
Chapter1: Starting With Matlab
Section: Chapter Questions
Problem 1P

Related questions
Question
answer all pls
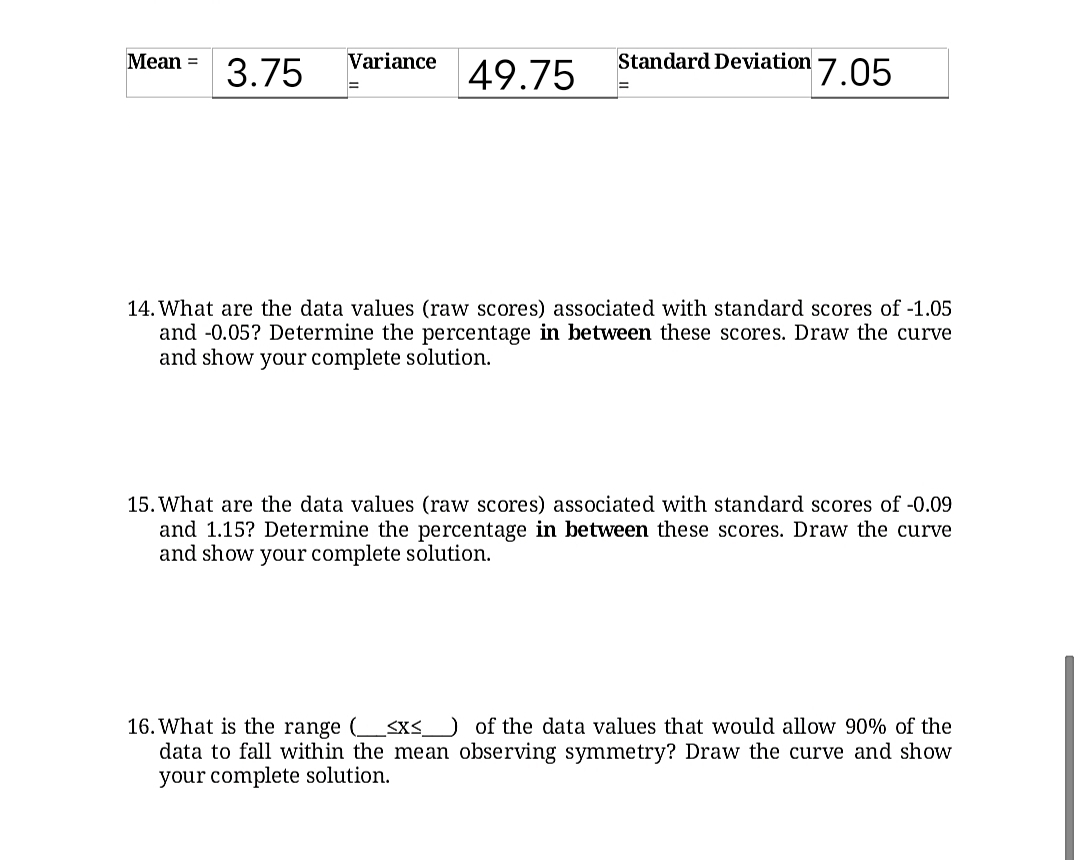
Transcribed Image Text:Mean =
Standard Deviation 7. 05
Variance
3.75
49.75
14. What are the data values (raw scores) associated with standard scores of -1.05
and -0.05? Determine the percentage in between these scores. Draw the curve
and show your complete solution.
15. What are the data values (raw scores) associated with standard scores of -0.09
and 1.15? Determine the percentage in between these scores. Draw the curve
and show your complete solution.
16. What is the range (<x<_ of the data values that would allow 90% of the
data to fall within the mean observing symmetry? Draw the curve and show
your complete solution.
Expert Solution
This question has been solved!
Explore an expertly crafted, step-by-step solution for a thorough understanding of key concepts.

Step by step
Solved in 4 steps with 3 images

Recommended textbooks for you
MATLAB: An Introduction with Applications
Statistics
ISBN:
9781119256830
Author:
Amos Gilat
Publisher:
John Wiley & Sons Inc

Probability and Statistics for Engineering and th…
Statistics
ISBN:
9781305251809
Author:
Jay L. Devore
Publisher:
Cengage Learning

Statistics for The Behavioral Sciences (MindTap C…
Statistics
ISBN:
9781305504912
Author:
Frederick J Gravetter, Larry B. Wallnau
Publisher:
Cengage Learning
MATLAB: An Introduction with Applications
Statistics
ISBN:
9781119256830
Author:
Amos Gilat
Publisher:
John Wiley & Sons Inc
Probability and Statistics for Engineering and th…
Statistics
ISBN:
9781305251809
Author:
Jay L. Devore
Publisher:
Cengage Learning
Statistics for The Behavioral Sciences (MindTap C…
Statistics
ISBN:
9781305504912
Author:
Frederick J Gravetter, Larry B. Wallnau
Publisher:
Cengage Learning

Elementary Statistics: Picturing the World (7th E…
Statistics
ISBN:
9780134683416
Author:
Ron Larson, Betsy Farber
Publisher:
PEARSON

The Basic Practice of Statistics
Statistics
ISBN:
9781319042578
Author:
David S. Moore, William I. Notz, Michael A. Fligner
Publisher:
W. H. Freeman

Introduction to the Practice of Statistics
Statistics
ISBN:
9781319013387
Author:
David S. Moore, George P. McCabe, Bruce A. Craig
Publisher:
W. H. Freeman