Researchers analyzed IQ data on preterm children at age 7-8 years. The mothers of the children in the study had chosen whether to provide their infants with breast milk within 72 hours of delivery. The researchers used the following designations. Group I: mothers declined to provide breast milk; Group lla: mothers had chosen but were unable to Grace provide breast milk and Group llb: mothers had chosen and were able to provide breast milk. The summary statistics on IQ are at the right. At the 10% significance level, do the data provide sufficient evidence to conclude that a difference exists in mean IQ at age 7-8 years for preterm children among the three groups? Critical values are given at the right Group Find the null and alternative hypotheses. Choose the correct answer below. OA M₂: OC. H: Not all the means are equal. M₂: "PP Find the test statistic (Round to two decimal places as needed.) Find the critical value (Round to two decimal places as needed.) Draw a conclusion H. At the 10% significance level, the data provide evidence to conclude that OB. H₂H S H₂HP P OD. H₂HP exists in mean 10 at age 7-8 years for preterm children among the three groups. H.: Not all the means are equal = 3 86 200 " 5 99.9 92.5 12.7 19.5 132 104.8 13.2 0.10 0.05 0.025 0.01 0.00 Fa 2.32 3.03 3.74 4.68 5.39
Researchers analyzed IQ data on preterm children at age 7-8 years. The mothers of the children in the study had chosen whether to provide their infants with breast milk within 72 hours of delivery. The researchers used the following designations. Group I: mothers declined to provide breast milk; Group lla: mothers had chosen but were unable to Grace provide breast milk and Group llb: mothers had chosen and were able to provide breast milk. The summary statistics on IQ are at the right. At the 10% significance level, do the data provide sufficient evidence to conclude that a difference exists in mean IQ at age 7-8 years for preterm children among the three groups? Critical values are given at the right Group Find the null and alternative hypotheses. Choose the correct answer below. OA M₂: OC. H: Not all the means are equal. M₂: "PP Find the test statistic (Round to two decimal places as needed.) Find the critical value (Round to two decimal places as needed.) Draw a conclusion H. At the 10% significance level, the data provide evidence to conclude that OB. H₂H S H₂HP P OD. H₂HP exists in mean 10 at age 7-8 years for preterm children among the three groups. H.: Not all the means are equal = 3 86 200 " 5 99.9 92.5 12.7 19.5 132 104.8 13.2 0.10 0.05 0.025 0.01 0.00 Fa 2.32 3.03 3.74 4.68 5.39

Glencoe Algebra 1, Student Edition, 9780079039897, 0079039898, 2018
18th Edition
ISBN:9780079039897
Author:Carter
Publisher:Carter
Chapter10: Statistics
Section: Chapter Questions
Problem 13PT

Related questions
Question
need ASAP please be fast and I'll rate positive for sure
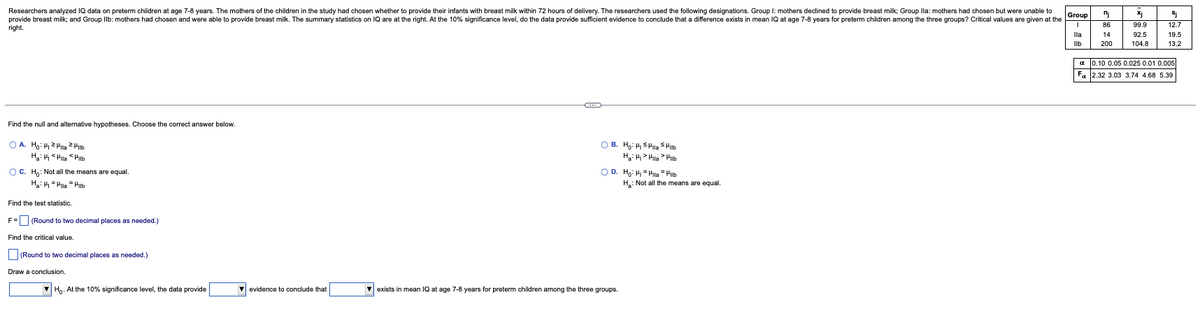
Transcribed Image Text:Researchers analyzed IQ data on preterm children at age 7-8 years. The mothers of the children in the study had chosen whether to provide their infants with breast milk within 72 hours of delivery. The researchers used the following designations. Group I: mothers declined to provide breast milk; Group Ila: mothers had chosen but were unable to
provide breast milk; and Group Ilb: mothers had chosen and were able to provide breast milk. The summary statistics on IQ are at the right. At the 10% significance level, do the data provide sufficient evidence to conclude that a difference exists in mean IQ at age 7-8 years for preterm children among the three groups? Critical values are given at the
right.
Find the null and alternative hypotheses. Choose the correct answer below.
OA. Ho: la Hilb
Ha: P <Pila<Hilb
OC. Ho: Not all the means are equal.
H₂: PPaPilb
Find the test statistic.
F= (Round to two decimal places as needed.)
Find the critical value.
(Round to two decimal places as needed.)
Draw a conclusion.
Ho. At the 10% significance level, the data provide
evidence to conclude that
OB. Ho-Hila Pilb
Ha: Pi>Hila > Hilb
OD. Ho: Pila Pil
▼ exists in mean IQ at age 7-8 years for preterm children among the three groups.
H: Not all the means are equal.
Group
T
Ila
llb
nj
14
200
xj
99.9
92.5
104.8
S₁
12.2
19.5
13.2
a 0.10 0.05 0.025 0.01 0.005
Fa 2.32 3.03 3.74 4.68 5.39
Expert Solution
This question has been solved!
Explore an expertly crafted, step-by-step solution for a thorough understanding of key concepts.

This is a popular solution!

Trending now
This is a popular solution!

Step by step
Solved in 5 steps with 1 images

Recommended textbooks for you
Glencoe Algebra 1, Student Edition, 9780079039897…
Algebra
ISBN:
9780079039897
Author:
Carter
Publisher:
McGraw Hill

Holt Mcdougal Larson Pre-algebra: Student Edition…
Algebra
ISBN:
9780547587776
Author:
HOLT MCDOUGAL
Publisher:
HOLT MCDOUGAL

College Algebra (MindTap Course List)
Algebra
ISBN:
9781305652231
Author:
R. David Gustafson, Jeff Hughes
Publisher:
Cengage Learning
Glencoe Algebra 1, Student Edition, 9780079039897…
Algebra
ISBN:
9780079039897
Author:
Carter
Publisher:
McGraw Hill
Holt Mcdougal Larson Pre-algebra: Student Edition…
Algebra
ISBN:
9780547587776
Author:
HOLT MCDOUGAL
Publisher:
HOLT MCDOUGAL
College Algebra (MindTap Course List)
Algebra
ISBN:
9781305652231
Author:
R. David Gustafson, Jeff Hughes
Publisher:
Cengage Learning