Balance sheet data for Alvarez Company on December 31, the end of two recent fiscal years, follows: Current Year Previous Year Current assets $345,510 $196,250 Property, plant, and equipment 596,790 557,350 Intangible assets 104,700 31,400 Current liabilities 240,810 141,300 Long-term liabilities 397,860 321,850 Common stock 125,640 117,750 Retained earnings 282,690 204,100 Prepare a comparative balance sheet for both years, stating each asset as a percent of total assets and each liability and stockholders' equity item as a percent of the total liabilities and stockholders' equity. If required, round percentages to one decimal place.
Balance sheet data for Alvarez Company on December 31, the end of two recent fiscal years, follows: Current Year Previous Year Current assets $345,510 $196,250 Property, plant, and equipment 596,790 557,350 Intangible assets 104,700 31,400 Current liabilities 240,810 141,300 Long-term liabilities 397,860 321,850 Common stock 125,640 117,750 Retained earnings 282,690 204,100 Prepare a comparative balance sheet for both years, stating each asset as a percent of total assets and each liability and stockholders' equity item as a percent of the total liabilities and stockholders' equity. If required, round percentages to one decimal place.

Chapter3: Evaluation Of Financial Performance
Section: Chapter Questions
Problem 19P

Related questions
Question
100%
3.
Current Year |
Previous Year | ||
| Current assets | $345,510 | $196,250 | |
| Property, plant, and equipment | 596,790 | 557,350 | |
| Intangible assets | 104,700 | 31,400 | |
| Current liabilities | 240,810 | 141,300 | |
| Long-term liabilities | 397,860 | 321,850 | |
| Common stock | 125,640 | 117,750 | |
| 282,690 | 204,100 |
Prepare a comparative balance sheet for both years, stating each asset as a percent of total assets and each liability and
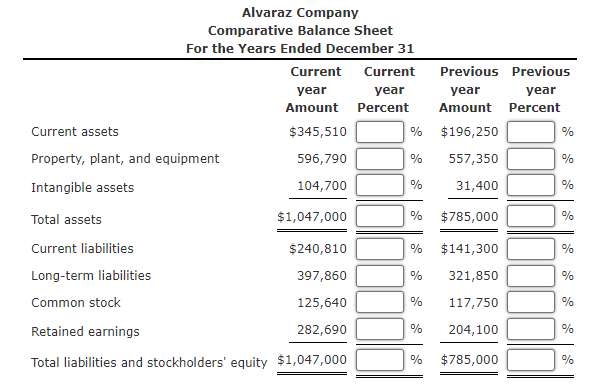
Transcribed Image Text:Alvaraz Company
Comparative Balance Sheet
For the Years Ended December 31
Current
Current
Previous Previous
year
year
year
year
Amount Percent
Amount
Percent
Current assets
$345,510
%
$196,250
%
Property, plant, and equipment
596,790
%
557,350
%
Intangible assets
104,700
%
31,400
%
Total assets
$1,047,000
%
$785,000
%
Current liabilities
$240,810
%
$141,300
%
Long-term liabilities
397,860
%
321,850
%
Common stock
125,640
117,750
%
Retained earnings
282,690
%
204,100
%
Total liabilities and stockholders' equity $1,047,000
%
$785,000
%
Expert Solution
This question has been solved!
Explore an expertly crafted, step-by-step solution for a thorough understanding of key concepts.

This is a popular solution!

Trending now
This is a popular solution!

Step by step
Solved in 2 steps

Recommended textbooks for you
EBK CONTEMPORARY FINANCIAL MANAGEMENT
Finance
ISBN:
9781337514835
Author:
MOYER
Publisher:
CENGAGE LEARNING - CONSIGNMENT

Survey of Accounting (Accounting I)
Accounting
ISBN:
9781305961883
Author:
Carl Warren
Publisher:
Cengage Learning
EBK CONTEMPORARY FINANCIAL MANAGEMENT
Finance
ISBN:
9781337514835
Author:
MOYER
Publisher:
CENGAGE LEARNING - CONSIGNMENT
Survey of Accounting (Accounting I)
Accounting
ISBN:
9781305961883
Author:
Carl Warren
Publisher:
Cengage Learning