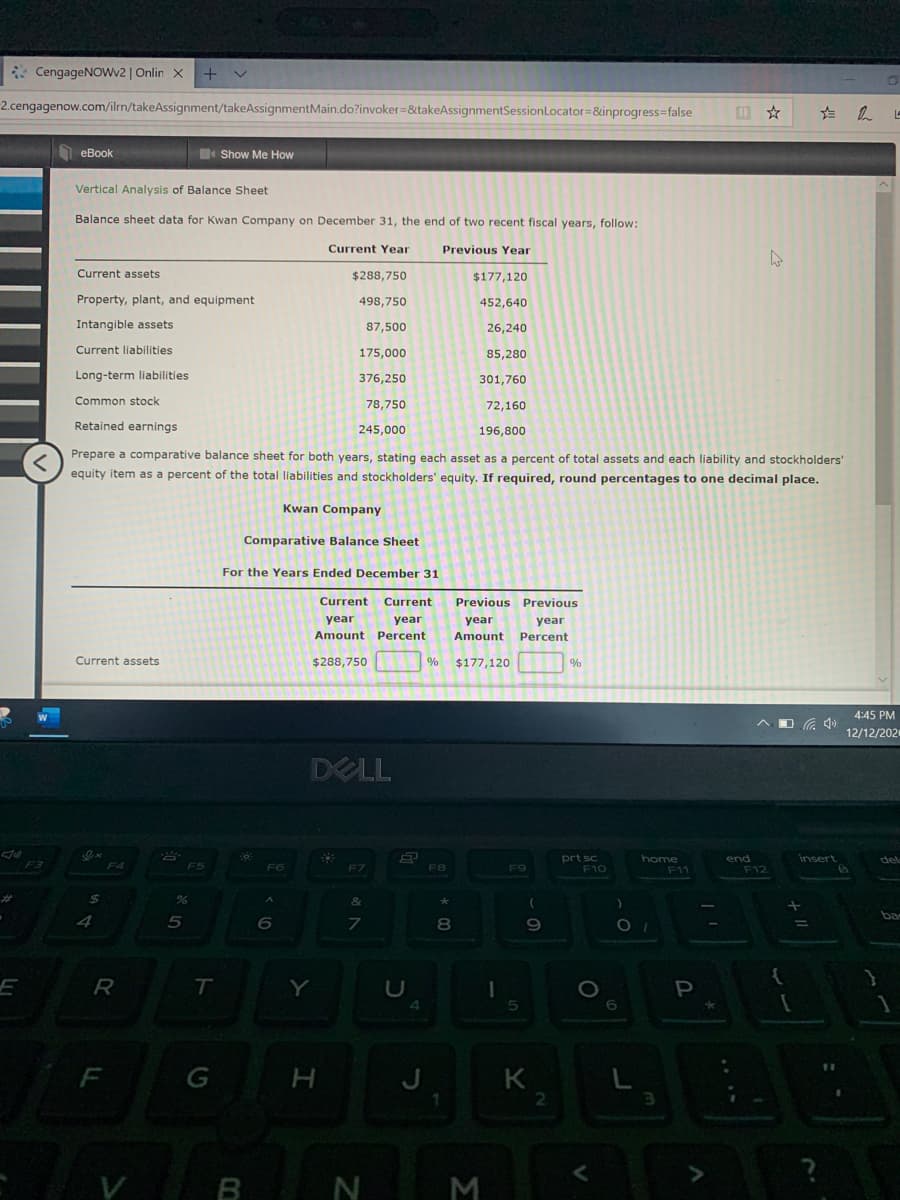
Balance sheet data for Kwan Company on December 31, the end of two recent fiscal years, follow: Current Year Previous Year Current assets $288,750 $177,120 Property, plant, and equipment 498,750 452,640 Intangible assets 87,500 26,240 Current liabilities 175,000 85,280 Long-term liabilities 376,250 301,760 Common stock 78,750 72,160 Retained earnings 245,000 196,800 
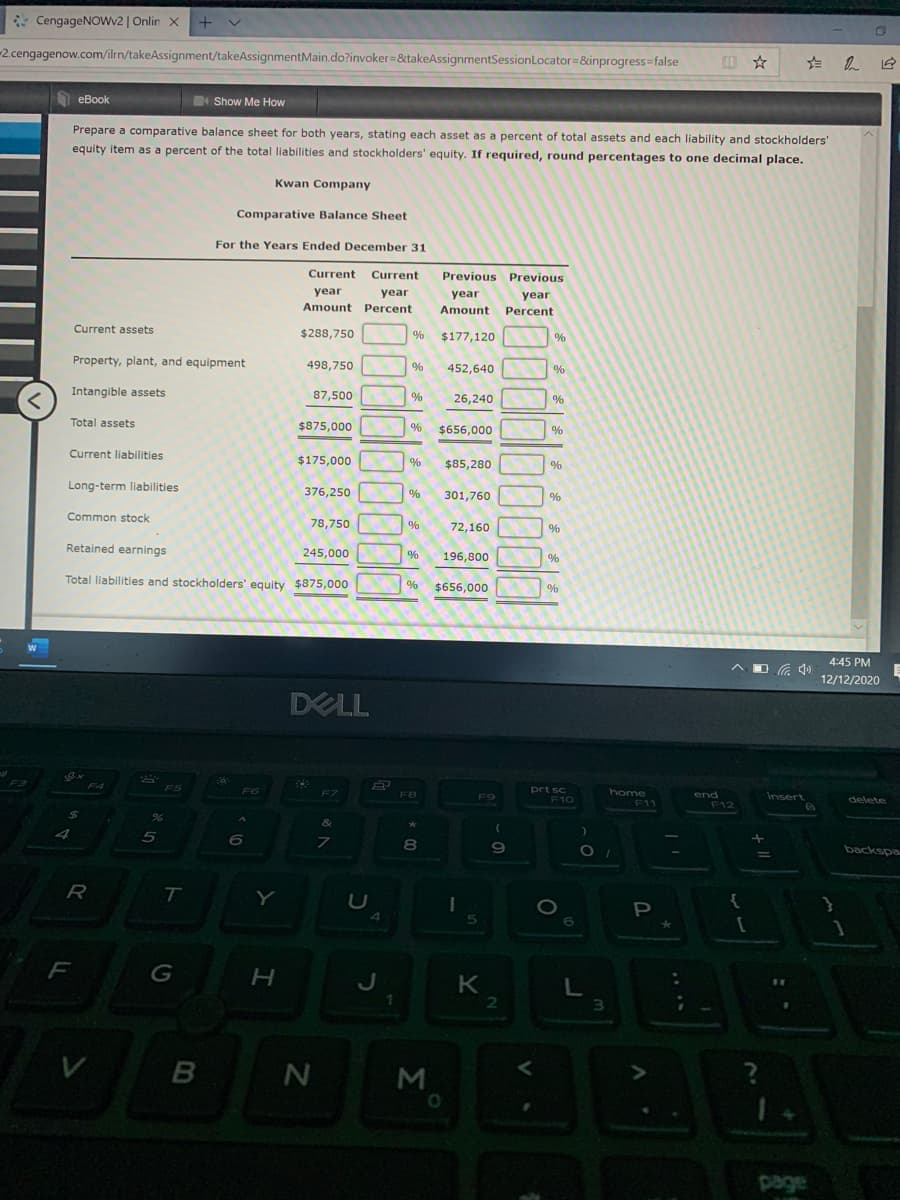
Prepare a comparative balance sheet for both years, stating each asset as a percent of total assets and each liability and stockholders' equity item as a percent of the total liabilities and stockholders' equity. If required, round percentages to one decimal place.
Q: Comparative financial statements for Weaver Company follow: Weaver Company Comparative Balance…
A: The cash flow statement is prepared to estimate the net cash inflow or outflow from the business…
Q: Balance sheet data for a company for the years ended December 31, 20Y2 and 20Y1, are shown below.…
A: Solution: Introduction: Comparative analysis would be done when there are two or more different…
Q: Vertical Analysis of Balance Sheet Balance sheet data for Alvarez Company on December 31, the end of…
A: Solution: Alvaraz Company Comparative Balance Sheet For the years ended Dec 31 Current…
Q: Vertical Analysis of Balance Sheet Balance sheet data for a company for the yvears ended December…
A: Balance sheet means a statement where all assets , liabilities and equity has been shown. Percentage…
Q: Balance sheet data for Novak Company on December 31, the end of two recent fiscal years, follows:…
A: Financial statements of a firm include income statement, balance sheet, cash flow statement and…
Q: Comparative financial statements for Weaver Company follow: Weaver Company Comparative Balance Sheet…
A: The cash flow statement is prepared to record cash flow from various activities as operating ,…
Q: Vertical Analysis of Balance Sheet Balance sheet data for Kwan Company on December 31, the end of…
A: Comparative balance sheet: The name itself says that comparison of financial position of an entity…
Q: Vertical Analysis of Balance Sheet Vertical Analysis of Balance Sheet Balance sheet data for Alvarez…
A: Balance sheet: This statement shows the assets and liabilities held by a company on a particular…
Q: The balance sheet data of Randolph Company for two recent years appears below: Assets: Year 2…
A: Financial analysis is widely used by companies to determine the profitability of the business and…
Q: Comparative financial statements for Weaver Company follow: Weaver Company Comparative Balance…
A: In the above question we have asked to prepare cash flow from operating activity from Direct method…
Q: The following data were taken from the balance sheet of Nilo Company at the end of two recent fiscal…
A: Formula: Current ratio = Current Assets / Current liabilities. Current Assets is divided with…
Q: The following data were taken from the balance sheet of Nilo Company at the end of two recent fiscal…
A: Ratio analysis involves evaluation of various financial aspects of the business such as liquidity,…
Q: The following data were taken from the balance sheet of Nilo Company at the end of two recent fiscal…
A: Working capital is the excess of current assets over current liabilities and the Current ratio is…
Q: Condensed data taken from the ledger of St. Louis Company at December 31, for the current and…
A: Horizontal analysis is prepared to calculate the variance from previous year by showing…
Q: The balance sheet data of Randolph Company for two recent years appears below: Assets: Year 2…
A: Horizontal Analysis Working Year 2 Year 1 Difference base year Percentage…
Q: Current Position Analysis The following data were taken from the balance sheet of Nilo Company at…
A:
Q: The comparative balance sheets and income statements for Gypsy Company follow: Balance Sheets As…
A: Cash flow statement is helpful for the stakeholders that they can identify the organization's…
Q: The balance sheet data below for Randolph Company for two recent years. Assets Year 2 Year 1…
A: Part-A Increase/(decrease) = Year 2 - Year 1 Increase/(decrease) percentage = Increase /…
Q: Condensed data taken from the ledger of St. Louis Company at December 31, for the current and…
A: Horizontal analysis is prepared to calculate the variance from previous year by showing…
Q: Balance sheet data for Alvarez Company on December 31, the end of two recent fiscal years, follow:…
A: Comparative balance sheet used to compare the financial statement of two or more periods. It is…
Q: Required information [The following information applies to the questions displayed below.) The…
A: Solution: Total Liabilities Reported $9,600 Working: Assets $22,000 Less:…
Q: Current Position Analysis The following data were taken from the balance sheet of Nilo Company at…
A: Ratio analysis is a method of measuring the financial position of the organization with different…
Q: Comparative financial statements for Weaver Company follow: Weaver Company Comparative Balance…
A: Introduction: A cash flow statement is a financial report that outlines a company's cash inflows…
Q: Current Position Analysis The following data were taken from the balance sheet of Nilo Company at…
A: 1. 2.
Q: The year-end financial statements of Calloway Company contained the following elements and…
A: We know that as per the accounting equation, total assets are equal to the addition of total…
Q: In the year end financial statements of calloway company contained the following elements and…
A: Formula to calculate the amount of liabilities:
Q: Current Position Analysis The following data were taken from the balance sheet of Albertini Company…
A: a. Sr No Ratio Current Year Previous Year 1 Working Capital =$1,288,000 =$882,000 Current…
Q: Use this information for Kellman Company to answer the question that follow. The balance sheets at…
A: Return on total assets: It can be defined as a financial ratio that measures the company’s…
Q: The balance sheets at the end of each of the first two years of operations indicate the following:…
A: Definition: Return on total assets: Return on total assets (ROTA) is a ratio that calculates a…
Q: The year-end financial statements of Calloway Company contained the following elements and…
A: We know that as per the accounting equation, total assets are equal to the addition of total…
Q: Balance sheet data for Alvarez Company on December 31, the end of two recent fiscal years, follows:…
A: Under vertical analysis of balance sheet, each account value is compared with total assets value for…
Q: Comparative financial statements for Weaver Company follow: Weaver Company Comparative Balance…
A: Introduction: A cash flow statement is a financial report which summarizes a company's cash inflows…
Q: Balance sheet data for a company for the years ended December 31, 20Y2 and 20Y1, are shown below.…
A: Comparative balance sheets are prepared to analyze the performance of an entity using the data of…
Q: Vertical Analysis of Balance Sheet Balance sheet data for Kwan Company on December 31, the end of…
A: Vertical analysis: The comparison of an item of a financial statement against the total amount of…
Q: Jertical Analysis of Balance Sheet Balance sheet data for a company for the years ended December 31,…
A: A comparative balance sheet is one of the financial statements that show an organization's financial…
Q: The comparative balance sheets and income statements for Gypsy Company follow: Balance Sheets As of…
A: The question is based on the concept of Cash flow statement. Cash flow statement is the statement…
Q: Comparative financial statement data for Carmono Company follow: This Year Last Year…
A: Statement of Cash Flow - Statement of Cash Flow shows the movement of cash for the financial year.…
Q: Balance sheet data for Alvarez Company on December 31, the end of two recent fiscal years, follows:…
A: A comparative balance sheet is a statement that shows the financial position of an organization over…
Q: Kwan Company Comparative Balance Sheet For the Years Ended December 31 Current Current Previous…
A: The Balance Sheet of Current and Previous year is given. Required Prepare Comparitive Balance Sheet…
Q: Vertical Analysis of Balance Sheet Balance sheet data for Alvarez Company on December 31, the end of…
A: Comparative balance sheet is a kind of balance sheet that encourage investors to analyze performance…
Q: Balance sheet data for Kwan Company on December 31, the end of two recent fiscal years, follow:…
A: Comparative balance sheets are used to compare data of one or more years. It is also helpful in…
Q: The following items are taken from the financial statements of Blue Spruce Company for the year…
A: Blue Spruce Company Income Statement For the period ending December 31, 2022 Sales revenue…
Q: The following data were taken from the balance sheet of Nilo Company at the end of two recent fiscal…
A: Lets start with the understanding of the working capital, Current and quick ratio. Working capital…
Q: data for Beaker Company for last year appear belo
A: The amount of income with the customer that is the residual income will increase Residual income…
Q: Comparative financial statement data for Carmono Company follow: This Year Last Year Assets Cash 3 6…
A:
Q: Balance sheet data for Alvarez Company on December 31, the end of two recent fiscal years, follow:…
A:
Q: Vertical Analysis of Balance Sheet Balance sheet data for Alvarez Company on December 31, the end of…
A: In a vertical analysis of Balance Sheet, individual assets and libilities are expressed as a…
Q: The following data were taken from the balance sheet of Nilo Company at the end of two recent fiscal…
A:
Trending now
This is a popular solution!
Step by step
Solved in 2 steps with 2 images
- Multiple-step income statement The following income statement for Curbstone Company was prepared for the year ended August 31, 20Y5: a. Identify the errors in the income statement. b. Prepare a corrected income statement.Your answer is partially correct. Try again. Using these data from the comparative balance sheet of Cullumber Company, perform horizontal analysis. (If amount and percentage are a decrease show the numbers as negative, e.g. -55,000, -20% or (55,000), (20%). Round percentages to 0 decimal places, e.g. 12%.) Increase or (Decrease) Dec. 31, 2022 Dec. 31, 2021 Amount Percentage Accounts receivable $ 608,400 $ 520,000 $Enter increase or decrease amount in dollars. Enter increase or decrease in percentages rounded to 0 decimal places. % Inventory $ 931,700 $ 770,000 $Enter increase or decrease amount in dollars. Enter increase or decrease in percentages rounded to 0 decimal points. % Total assets $3,381,000 $2,940,000 $Enter increase or decrease amount in dollars. Enter increase or decrease in percentages rounded to 0 decimal points. %Using these data from the comparative balance sheet of Ivanhoe Company, perform horizontal analysis. (If amount and percentage are a decrease show the numbers as negative, e.g. -55,000, -20% or (55,000), (20%). Round percentages to 0 decimal places, e.g. 12%.) Increase or (Decrease) Dec. 31, 2022 Dec. 31, 2021 Amount Percentage Accounts receivable $ 487,200 $ 420,000 $Enter increase or decrease amount in dollars. Enter increase or decrease in percentages rounded to 0 decimal places. % Inventory $ 804,000 $ 670,000 $Enter increase or decrease amount in dollars. Enter increase or decrease in percentages rounded to 0 decimal points. % Total assets $3,237,600 $2,840,000 $Enter increase or decrease amount in dollars. Enter increase or decrease in percentages rounded to 0 decimal points. %
- Use the following comparative balance sheets and additional information to answer questions (1) through (4). MKH Company Comparative Balance Sheets For the year ended December 31 20X1 20X0 Change Current assets Cash $324,700 $217,600 $107,100 Accounts receivable 132,600 165,200 (32,600) Inventory 175,100 137,200 37,900 Prepaid rent 25,500 14,400 11,100 Total current assets $657,900 $534,400 $123,500 Long-term assets Land $326,400 $345,600 ($19,200) Equipment (net) 321,300 356,300 (35,000) Total long-term assets $647,700 $701,900 $(54,200) Total assets $1,305,600 $1,236,300 $69,300 Current liabilities Accounts payable $145,800 $131,200 $14,600 Salaries payable 18,700 4,800 13,900 Interest payable 32,300 27,200 5,100 Total current liabilities $196,800 $163,200 $33,600 Long-term…Use the following comparative balance sheets and additional information to answer questions (1) through (4). MKH Company Comparative Balance Sheets For the year ended December 31 20X1 20X0 Change Current assets Cash $324,700 $217,600 $107,100 Accounts receivable 132,600 165,200 (32,600) Inventory 175,100 137,200 37,900 Prepaid rent 25,500 14,400 11,100 Total current assets $657,900 $534,400 $123,500 Long-term assets Land $326,400 $345,600 ($19,200) Equipment (net) 321,300 356,300 (35,000) Total long-term assets $647,700 $701,900 $(54,200) Total assets $1,305,600 $1,236,300 $69,300 Current liabilities Accounts payable $145,800 $131,200 $14,600 Salaries payable 18,700 4,800 13,900 Interest payable 32,300 27,200 5,100 Total current liabilities $196,800 $163,200 $33,600 Long-term…Using these data from the comparative balance sheet of Cullumber Company, perform horizontal analysis. (If amount and percentage are a decrease show the numbers as negative, e.g. -55,000, -20% or (55,000), (20%). Round percentages to 0 decimal places, e.g. 12%.) Increase or (Decrease) Dec. 31, 2022 Dec. 31, 2021 Amount Percentage Accounts receivable $ 608,400 $ 520,000 $Enter increase or decrease amount in dollars. Enter increase or decrease in percentages rounded to 0 decimal places. % Inventory $ 931,700 $ 770,000 $Enter increase or decrease amount in dollars. Enter increase or decrease in percentages rounded to 0 decimal points. % Total assets $3,381,000 $2,940,000 $Enter increase or decrease amount in dollars. Enter increase or decrease in percentages rounded to 0 decimal points. %
- The comparative balance sheet of Coulson, Inc. at December 31, 20Y2 and 20Y1, is asfollows:Dec. 31, 20Y2 Dec. 31, 20Y1AssetsCash . . . . . . . . . . . . . . . . . . . . . . . . . . . . . . . . . . . . . . . . . . . . . . . . . . . . . $ 300,600 $ 337,800Accounts receivable (net) . . . . . . . . . . . . . . . . . . . . . . . . . . . . . . . . . . 704,400 609,600Inventories . . . . . . . . . . . . . . . . . . . . . . . . . . . . . . . . . . . . . . . . . . . . . . . 918,600 865,800Prepaid expenses . . . . . . . . . . . . . . . . . . . . . . . . . . . . . . . . . . . . . . . . . 18,600 26,400Land . . . . . . . . . . . . . . . . . . . . . . . . . . . . . . . . . . . . . . . . . . . . . . . . . . . . . 990,000 1,386,000 Buildings . . . . . . . . . . . . . . . . . . . . . . . . . . . . . . . . . . . . . . . . . . . . . . . . . $1,980,000 $ 990,000Accumulated depreciation—buildings . . . . . . . . . . . . . . . . . . . . . (397,200) (366,000)Equipment . . . . . . . . . . . . . . . . . . .…Pleasantville Company had the following balance sheet on January 1. Pleasantville CompanyBalance SheetJanuary 1 1Cash$175,000.00Accounts Payable$57,000.002Inventory157,000.00Notes Payable250,000.003Property, Plant, and Equipment200,000.00Mortgage Payable150,000.004Patent25,000.00Retained Earnings100,000.005$557,000.00$557,000.00 On January 2, Carrs Company came to an agreement to purchase Pleasantville by acquiring all of its outstanding shares for $575,000 in cash. On that date in time, the fair value of their inventory was $150,000, and the fair value of the equipment was $225,000. The book value equals the fair value for all other accounts listed.Required:1. Compute the goodwill associated with the purchase of Pleasantville.2. Prepare the journal entry necessary at January 2, to record the acquisition of Pleasantville.(b)Prepare a vertical analysis of the income statement data for Oriole Corporation for both years. (Round percentages to 1 decimal place, e.g. 12.1%.) ORIOLE CORPORATIONCondensed Income Statementschoose the accounting period For the Years Ended December 31For the Month Ended December 31December 31 2022 2021 $ Percent $ Percent Net sales $632,300 enter percentages rounded to 1 decimal place % $544,800 enter percentages rounded to 1 decimal place % Cost of goods sold 456,600 enter percentages rounded to 1 decimal place % 415,500 enter percentages rounded to 1 decimal place % Gross Profit 175,700 enter percentages rounded to 1 decimal place % 129,300 enter percentages rounded to 1 decimal place % Operating expenses 74,100 enter percentages rounded to 1 decimal place % 44,500 enter percentages rounded to 1 decimal…
- The comparative balance sheet of Whitman Co. at December 31, 20Y2 and 20Y1, is as follows:Dec. 31, 20Y2 Dec. 31, 20Y1AssetsCash . . . . . . . . . . . . . . . . . . . . . . . . . . . . . . . . . . . . . . . . . . . . . . . . . . . . . . . . . $ 918,000 $ 964,800Accounts receivable (net) . . . . . . . . . . . . . . . . . . . . . . . . . . . . . . . . . . . . . . 828,900 761,940Inventories . . . . . . . . . . . . . . . . . . . . . . . . . . . . . . . . . . . . . . . . . . . . . . . . . . . 1,268,460 1,162,980Prepaid expenses . . . . . . . . . . . . . . . . . . . . . . . . . . . . . . . . . . . . . . . . . . . . . . . 29,340 35,100Land . . . . . . . . . . . . . . . . . . . . . . . . . . . . . . . . . . . . . . . . . . . . . . . . . . . . . . . . . . . 315,900 479,700Buildings . . . . . . . . . . . . . . . . . . . . . . . . . . . . . . . . . . . . . . . . . . . . . . . . . . . . . . . 1,462,500 900,900Accumulated depreciation—buildings . . . . . . . . . . . . . . . . . . . . . . . . . . .…Listed below are the current Accounting Assumptions and Principles Economic Entity Assumption Monetary Unit Assumption Historical Cost Principle Going Concern Assumption Revenue Recognition Principle Full Disclosure Principle Time Period Assumption Matching Principle Required: For the following situations, identify whether the situation represents a violation or a correct application of GAAP, and which assumption/principle is applicable. h. Nixon Corp records and maintains their books at cost and/or current value, not at a liquidated value. Violation: (Yes/No) Applicable Assumption/Principle: i. Wages of $4,000 related to the last two days of July, were recorded as expense in July even though they were paid in August. Violation: (Yes/No) Applicable…Question 1The following information was extracted from the financial statement of Barryfor the year ended 31 December 2020. RMSales 437,500Opening inventories 17,500Closing inventories 26,250Cost of sales 262,500Other income 3,750Expenses 61,250Current liabilities 47,250Trade receivables 39,375Bank 8,750Cash 31,500Required:(a) Show the formulae and compute the value of the following for Barry:(i) Purchases(ii) Gross profit(iii)Net Profit