We are looking at the gas prices at two different gas stations. Let X be the gas price at the one gas station, and Y be the gas price at the other gas station at a random day. The registration of X and Y at 10 random days gave the data: Tod 1 2 3 4 7 8. 9. 10 ay i Xi 14.89 14.39 13.20 15.35 15.10 14.39 14.96 15.15 14.69 13.57 Yi 14.99 14.39 13.65 15.25 14.99 14.09 14.66 15.25 14.36 13.57 It it given at E-1 Xi = E (yi – 9)² = 3.414 og E (x; – 7)(yi – 9) = 3.670. 145.69, E1 Yi = 145.20, E1(x; – T)² = 4.436 vi=1 a) Calculate the correlation between the gas prices and comment the results. b) Calculate a estimated linear regression for the coherence between the gas prices at those two gas stations. c) Make a scatter plot for the data and draw the linear regression into the scatter plot.
We are looking at the gas prices at two different gas stations. Let X be the gas price at the one gas station, and Y be the gas price at the other gas station at a random day. The registration of X and Y at 10 random days gave the data: Tod 1 2 3 4 7 8. 9. 10 ay i Xi 14.89 14.39 13.20 15.35 15.10 14.39 14.96 15.15 14.69 13.57 Yi 14.99 14.39 13.65 15.25 14.99 14.09 14.66 15.25 14.36 13.57 It it given at E-1 Xi = E (yi – 9)² = 3.414 og E (x; – 7)(yi – 9) = 3.670. 145.69, E1 Yi = 145.20, E1(x; – T)² = 4.436 vi=1 a) Calculate the correlation between the gas prices and comment the results. b) Calculate a estimated linear regression for the coherence between the gas prices at those two gas stations. c) Make a scatter plot for the data and draw the linear regression into the scatter plot.

Holt Mcdougal Larson Pre-algebra: Student Edition 2012
1st Edition
ISBN:9780547587776
Author:HOLT MCDOUGAL
Publisher:HOLT MCDOUGAL
Chapter11: Data Analysis And Probability
Section: Chapter Questions
Problem 8CR

Related questions

Question
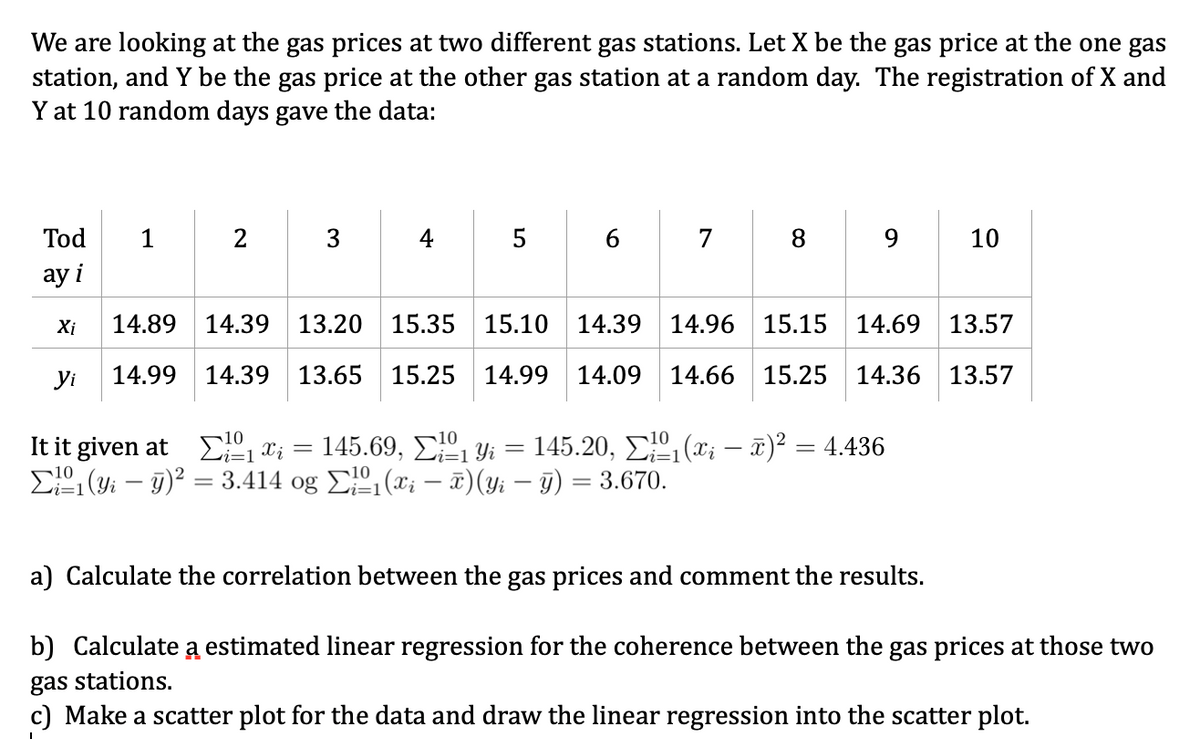
Transcribed Image Text:We are looking at the gas prices at two different gas stations. Let X be the gas price at the one gas
station, and Y be the gas price at the other gas station at a random day. The registration of X and
Y at 10 random days gave the data:
Tod
1
5
6.
7
8.
10
ay i
Xi
14.89
14.39
13.20 15.35 15.10
14.39
14.96 15.15 14.69 13.57
yi
14.99 14.39 13.65 15.25
14.99
14.09
14.66 15.25 14.36 13.57
It it given at E1 t; = 145.69, E1 Yi = 145.20, E1 (x; – T)² = 4.436
E1 (yi – 9)² = 3.414 og E (x; –- x)(y; – 9) = 3.670.
|3D
a) Calculate the correlation between the gas prices and comment the results.
b) Calculate a estimated linear regression for the coherence between the gas prices at those two
gas stations.
c) Make a scatter plot for the data and draw the linear regression into the scatter plot.
3.
Expert Solution
This question has been solved!
Explore an expertly crafted, step-by-step solution for a thorough understanding of key concepts.

Step by step
Solved in 3 steps with 3 images

Knowledge Booster


Learn more about
Need a deep-dive on the concept behind this application? Look no further. Learn more about this topic, statistics and related others by exploring similar questions and additional content below.Recommended textbooks for you
Holt Mcdougal Larson Pre-algebra: Student Edition…
Algebra
ISBN:
9780547587776
Author:
HOLT MCDOUGAL
Publisher:
HOLT MCDOUGAL
Holt Mcdougal Larson Pre-algebra: Student Edition…
Algebra
ISBN:
9780547587776
Author:
HOLT MCDOUGAL
Publisher:
HOLT MCDOUGAL