A developmental psychologist who wanted to see if children who started walking earlier performed better in the school divided 30 children into 3 groups: early walkers, middle walkers, and late walkers. At the end of second grade, the psychologist computed a composite school performance score based on teachers' reports. Here is the data: Early walkers: M=2.94 (SD=.61) Middle walkers: M=2.84 (SD=.70) Late walkers: M=2.77 (SD=.64) The psychologist ran an ANOVA and found that F(2,27) = .86. What jumps out at you about these results? Were these significant findings? Can you tell just by comparing the means? What number here tells you if there is the significance? You will have to go to the table to find the cutoff score to finish solving this puzzle.....then discuss this problem amongst yourselves. Note: You're not working anything out; you're just looking at the output I have provided.
MATLAB: An Introduction with Applications
6th Edition
ISBN:9781119256830
Author:Amos Gilat
Publisher:Amos Gilat
Chapter1: Starting With Matlab
Section: Chapter Questions
Problem 1P
icon
Related questions
Question

A developmental psychologist who wanted to see if children who started walking earlier performed better in the school divided 30 children into 3 groups: early walkers, middle walkers, and late walkers.  At the end of second grade, the psychologist computed a composite school performance score based on teachers' reports.  Here is the data:

Early walkers: M=2.94 (SD=.61)

Middle walkers: M=2.84 (SD=.70)

Late walkers: M=2.77 (SD=.64)

The psychologist ran an ANOVA and found that F(2,27) = .86. 

What jumps out at you about these results?  Were these significant findings?  Can you tell just by comparing the means?  What number here tells you if there is the significance? 

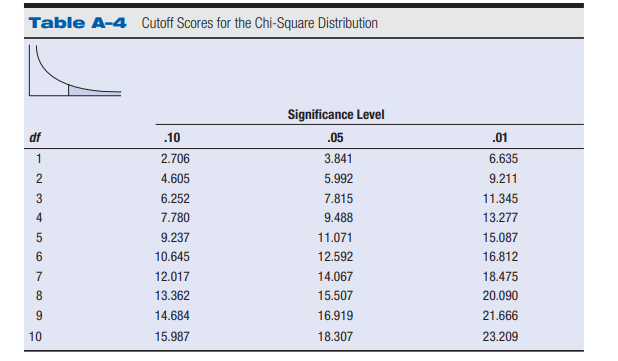
You will have to go to the table to find the cutoff score to finish solving this puzzle.....then discuss this problem amongst yourselves.   

Note: You're not working anything out; you're just looking at the output I have provided.


Table A-4 Cutoff Scores for the Chi-Square Distribution
Significance Level
df
.10
.05
.01
2.706
3.841
6.635
2
4.605
5.992
9.211
3
6.252
7.815
11.345
4
7.780
9.488
13.277
9.237
11.071
15.087
10.645
12.592
16.812
12.017
14.067
18.475
8.
13.362
15.507
20.090
9.
14.684
16.919
21.666
10
15.987
18.307
23.209
Transcribed Image Text:Table A-4 Cutoff Scores for the Chi-Square Distribution Significance Level df .10 .05 .01 2.706 3.841 6.635 2 4.605 5.992 9.211 3 6.252 7.815 11.345 4 7.780 9.488 13.277 9.237 11.071 15.087 10.645 12.592 16.812 12.017 14.067 18.475 8. 13.362 15.507 20.090 9. 14.684 16.919 21.666 10 15.987 18.307 23.209
Expert Solution
trending now

Trending now

This is a popular solution!

steps

Step by step

Solved in 2 steps with 4 images

Blurred answer
Recommended textbooks for you
MATLAB: An Introduction with Applications
Statistics
ISBN:
9781119256830
Author:
Amos Gilat
Publisher:
John Wiley & Sons Inc
Probability and Statistics for Engineering and th…
Statistics
ISBN:
9781305251809
Author:
Jay L. Devore
Publisher:
Cengage Learning
Statistics for The Behavioral Sciences (MindTap C…
Statistics
ISBN:
9781305504912
Author:
Frederick J Gravetter, Larry B. Wallnau
Publisher:
Cengage Learning
Elementary Statistics: Picturing the World (7th E…
Statistics
ISBN:
9780134683416
Author:
Ron Larson, Betsy Farber
Publisher:
PEARSON
The Basic Practice of Statistics
Statistics
ISBN:
9781319042578
Author:
David S. Moore, William I. Notz, Michael A. Fligner
Publisher:
W. H. Freeman
Introduction to the Practice of Statistics
Statistics
ISBN:
9781319013387
Author:
David S. Moore, George P. McCabe, Bruce A. Craig
Publisher:
W. H. Freeman