We estimate the following model where price je is the price of house j in year t and is a Exercise 1. function of the distance to the nearest recreation park using a dataset with 578 observations. In particular, the variable in the model is measured as the difference between the distance of each house to the park and 150 yards. The OLS regression line is priče = 850000 + 164 (distance - 150) (150000) (41) Where standard errors of the estimated coefficients are in parentheses.
We estimate the following model where price je is the price of house j in year t and is a Exercise 1. function of the distance to the nearest recreation park using a dataset with 578 observations. In particular, the variable in the model is measured as the difference between the distance of each house to the park and 150 yards. The OLS regression line is priče = 850000 + 164 (distance - 150) (150000) (41) Where standard errors of the estimated coefficients are in parentheses.

Chapter4: Linear Functions
Section4.3: Fitting Linear Models To Data
Problem 34SE: For the following exercises, consider this scenario: The profit of a company decreased steadily...

Related questions
Question
Transcribed Image Text:We estimate the following model where price je is the price of house j in year t and is a
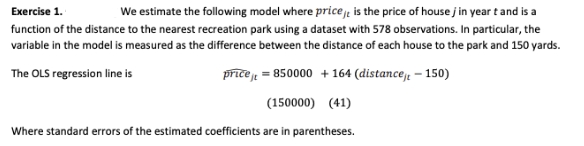
Exercise 1.
function of the distance to the nearest recreation park using a dataset with 578 observations. In particular, the
variable in the model is measured as the difference between the distance of each house to the park and 150 yards.
The OLS regression line is
price j = 850000 + 164 (distancej, – 150)
(150000) (41)
Where standard errors of the estimated coefficients are in parentheses.
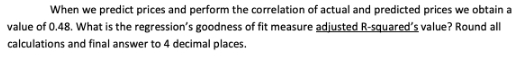
Transcribed Image Text:When we predict prices and perform the correlation of actual and predicted prices we obtain a
value of 0.48. What is the regression's goodness of fit measure adjusted R-squared's value? Round all
calculations and final answer to 4 decimal places.
Expert Solution
This question has been solved!
Explore an expertly crafted, step-by-step solution for a thorough understanding of key concepts.

Step by step
Solved in 2 steps with 2 images

Recommended textbooks for you

Algebra & Trigonometry with Analytic Geometry
Algebra
ISBN:
9781133382119
Author:
Swokowski
Publisher:
Cengage

Glencoe Algebra 1, Student Edition, 9780079039897…
Algebra
ISBN:
9780079039897
Author:
Carter
Publisher:
McGraw Hill
Algebra & Trigonometry with Analytic Geometry
Algebra
ISBN:
9781133382119
Author:
Swokowski
Publisher:
Cengage
Glencoe Algebra 1, Student Edition, 9780079039897…
Algebra
ISBN:
9780079039897
Author:
Carter
Publisher:
McGraw Hill

Algebra and Trigonometry (MindTap Course List)
Algebra
ISBN:
9781305071742
Author:
James Stewart, Lothar Redlin, Saleem Watson
Publisher:
Cengage Learning

Trigonometry (MindTap Course List)
Trigonometry
ISBN:
9781337278461
Author:
Ron Larson
Publisher:
Cengage Learning