We have a time series dataset from the US which includes the following variables for the period 1960- 1999: Y: Per capita chicken consumption (in pounds) in year t. PC: The price of chicken (in cents per pound) in year t. PB: The price of beef (in cents per pound) in year t. YD: Per capita disposable income (in hundreds of dollars) in year t. YD2: YDsquared, i.e. YD2, = YD² We estimate by OLS the following regression . Dependent variable: Y Number of observations: 40 Variable intercept PC PB YD YD2 R-squared F statistic (p-value) model: Table 2 Coefficient 27.6 -0.61 0.09 0.20 -0.0001 0.99 8.74 (0.006) Standard Error 1.58 0.16 0.04 0.01 0.00005
We have a time series dataset from the US which includes the following variables for the period 1960- 1999: Y: Per capita chicken consumption (in pounds) in year t. PC: The price of chicken (in cents per pound) in year t. PB: The price of beef (in cents per pound) in year t. YD: Per capita disposable income (in hundreds of dollars) in year t. YD2: YDsquared, i.e. YD2, = YD² We estimate by OLS the following regression . Dependent variable: Y Number of observations: 40 Variable intercept PC PB YD YD2 R-squared F statistic (p-value) model: Table 2 Coefficient 27.6 -0.61 0.09 0.20 -0.0001 0.99 8.74 (0.006) Standard Error 1.58 0.16 0.04 0.01 0.00005

Glencoe Algebra 1, Student Edition, 9780079039897, 0079039898, 2018
18th Edition
ISBN:9780079039897
Author:Carter
Publisher:Carter
Chapter10: Statistics
Section10.6: Summarizing Categorical Data
Problem 31PPS

Related questions
Question

Transcribed Image Text:b)
What is the predicted effect of increasing the price of beef by a dollar (100 cents) on
chicken consumption?
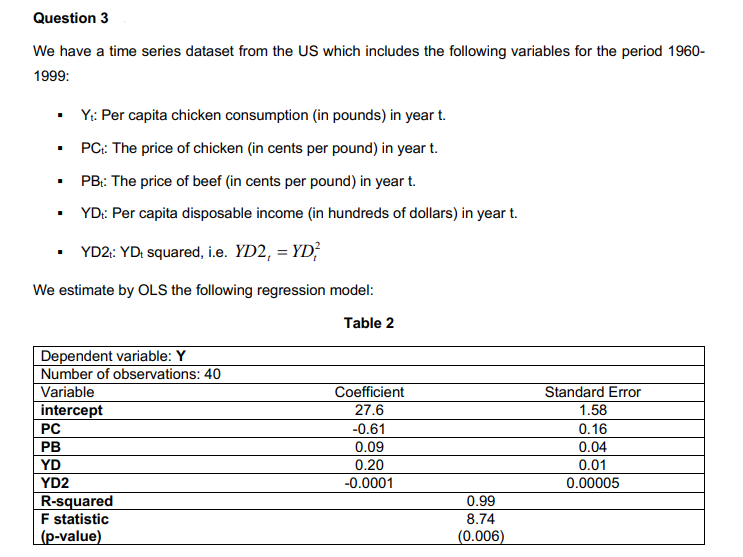
Transcribed Image Text:Question 3
We have a time series dataset from the US which includes the following variables for the period 1960-
1999:
Yt: Per capita chicken consumption (in pounds) in year t.
PC: The price of chicken (in cents per pound) in year t.
PB: The price of beef (in cents per pound) in year t.
YD: Per capita disposable income (in hundreds of dollars) in year t.
YD2t: YD+ squared, i.e. YD2, = YD²
We estimate by OLS the following regression model:
Table 2
.
.
Dependent variable: Y
Number of observations: 40
Variable
intercept
PC
PB
YD
YD2
R-squared
F statistic
(p-value)
Coefficient
27.6
-0.61
0.09
0.20
-0.0001
0.99
8.74
(0.006)
Standard Error
1.58
0.16
0.04
0.01
0.00005
Expert Solution
This question has been solved!
Explore an expertly crafted, step-by-step solution for a thorough understanding of key concepts.

Step by step
Solved in 2 steps

Recommended textbooks for you
Glencoe Algebra 1, Student Edition, 9780079039897…
Algebra
ISBN:
9780079039897
Author:
Carter
Publisher:
McGraw Hill


Trigonometry (MindTap Course List)
Trigonometry
ISBN:
9781337278461
Author:
Ron Larson
Publisher:
Cengage Learning
Glencoe Algebra 1, Student Edition, 9780079039897…
Algebra
ISBN:
9780079039897
Author:
Carter
Publisher:
McGraw Hill
Trigonometry (MindTap Course List)
Trigonometry
ISBN:
9781337278461
Author:
Ron Larson
Publisher:
Cengage Learning

College Algebra (MindTap Course List)
Algebra
ISBN:
9781305652231
Author:
R. David Gustafson, Jeff Hughes
Publisher:
Cengage Learning

Holt Mcdougal Larson Pre-algebra: Student Edition…
Algebra
ISBN:
9780547587776
Author:
HOLT MCDOUGAL
Publisher:
HOLT MCDOUGAL