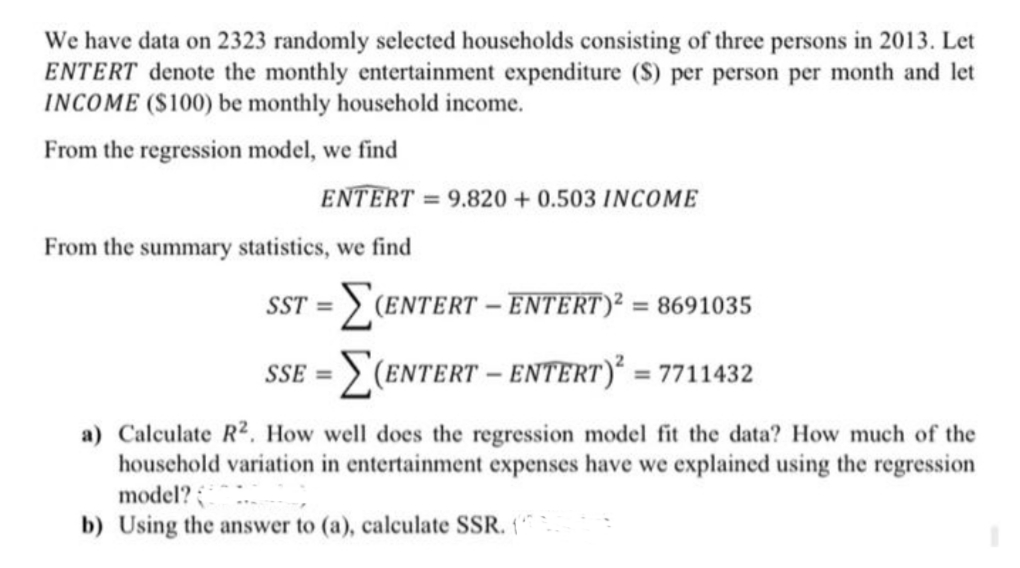
We have data on 2323 randomly selected households consisting of three persons in 2013. Let ENTERT denote the monthly entertainment expenditure (S) per person per month and let INCOME (S100) be monthly household income. From the regression model, we find ENTERT = 9.820 + 0.503 INCOME From the summary statistics, we find SST = > (ENTERT – ENTERT)² = 8691035 SSE = > (ENTERT – ENTERT)² = 7711432 %3D a) Calculate R². How well does the regression model fit the data? How much of the household variation in entertainment expenses have we explained using the regression model? b) Using the answer to (a), calculate SSR. (
We have data on 2323 randomly selected households consisting of three persons in 2013. Let ENTERT denote the monthly entertainment expenditure (S) per person per month and let INCOME (S100) be monthly household income. From the regression model, we find ENTERT = 9.820 + 0.503 INCOME From the summary statistics, we find SST = > (ENTERT – ENTERT)² = 8691035 SSE = > (ENTERT – ENTERT)² = 7711432 %3D a) Calculate R². How well does the regression model fit the data? How much of the household variation in entertainment expenses have we explained using the regression model? b) Using the answer to (a), calculate SSR. (

Managerial Economics: Applications, Strategies and Tactics (MindTap Course List)
14th Edition
ISBN:9781305506381
Author:James R. McGuigan, R. Charles Moyer, Frederick H.deB. Harris
Publisher:James R. McGuigan, R. Charles Moyer, Frederick H.deB. Harris
Chapter4: Estimating Demand
Section: Chapter Questions
Problem 3E

Related questions

Question
E3
Transcribed Image Text:We have data on 2323 randomly selected households consisting of three persons in 2013. Let
ENTERT denote the monthly entertainment expenditure (S) per person per month and let
INCOME ($100) be monthly household income.
From the regression model, we find
ENTERT = 9.820 +0.503 INCOME
From the summary statistics, we find
SST = > (ENTERT – ENTERT)² = 8691035
%3D
SSE = > (Entert - ENTERT)² = 7711432
a) Calculate R². How well does the regression model fit the data? How much of the
houschold variation in entertainment expenses have we explained using the regression
model?
b) Using the answer to (a), calculate SSR. (
Expert Solution
This question has been solved!
Explore an expertly crafted, step-by-step solution for a thorough understanding of key concepts.

This is a popular solution!

Trending now
This is a popular solution!

Step by step
Solved in 3 steps

Knowledge Booster


Learn more about
Need a deep-dive on the concept behind this application? Look no further. Learn more about this topic, economics and related others by exploring similar questions and additional content below.Recommended textbooks for you
Managerial Economics: Applications, Strategies an…
Economics
ISBN:
9781305506381
Author:
James R. McGuigan, R. Charles Moyer, Frederick H.deB. Harris
Publisher:
Cengage Learning
Managerial Economics: Applications, Strategies an…
Economics
ISBN:
9781305506381
Author:
James R. McGuigan, R. Charles Moyer, Frederick H.deB. Harris
Publisher:
Cengage Learning