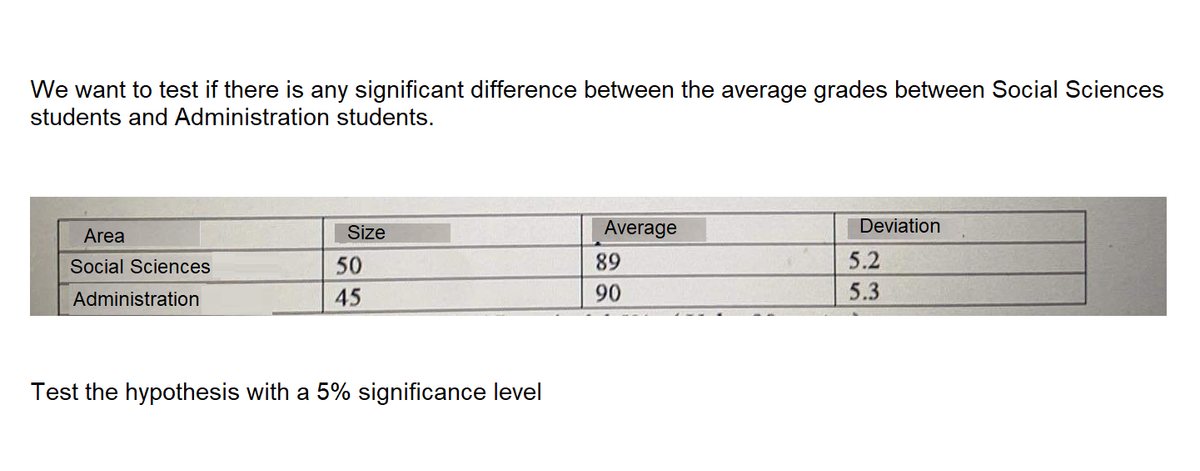
We want to test if there is any significant difference between the average grades between Social Sciences students and Administration students. Size Average Deviation Area Social Sciences 50 89 5.2 Administration 45 90 5.3 Test the hypothesis with a 5% significance level


Q: Total= 164 Gender Frequency Relative Frequency Female 118 0.7195122 Male 46 0.2804878 #1 Find Sample…
A:
Q: What kind of parameter is applied in the given situation? “The mean height of all Grade 11 students…
A: Given
Q: Roman, a health data officer, was tasked to create a report describing the height of all the…
A: Central tendency is the property of concentration of the values around a central value in a data.…
Q: Two random samples gave the following information: Sample Sample mean Sum of square of deviation…
A: The hypotheses are given below: Null hypothesis: H0: µ1 = µ2 Alternative hypothesis: HA: µ1 ≠ µ2…
Q: State the null hypothesis, Ho, and the alternative hypothesis, Ha, that would be used to test these…
A: a) H0 : μd≤15H1 : μd>15 b) H0 : μd≤10H1 : μd>10
Q: The standard deviation of a point estimator is called the Select one: O a.variance of estimation. O…
A: Standard error is also called standard deviation of point estimator. SE = σn
Q: Mr. Green examines the Unit 1 Biology test scores in his class. The test scores are normall-…
A: The z-score is known as the standard score.
Q: The standard deviation or variance is an important measurement in a production process to analyse…
A:
Q: Which of the data set(s) is the most affected by a systematic error? %Deviation for Replicate…
A: Systematic error: It ususally affects measurements the same amount or by the same proportion,…
Q: Which measure(s) would not be used when you calculate the standard error of the mean? p-values…
A: The standard error measures, roughly, the average difference between the statistic and the…
Q: Do people walk faster in the airport when they are departing (getting on a plane) or do they walk…
A: There are two independent samples which are departure and arrival. We have to test whether…
Q: The sample mean x with a bar above it is the best point estimate of the sample mean mu?
A: Point estimators are statistic used to estimate the unknown parameter of population. We know that…
Q: A recommendation for the amount of vitamin C that a person should have per day is 75 mg. A…
A: given that
Q: 17.) What is the scale parameter? O a. Mean O b. Variance c. Standard Deviation
A: We have given that the statement about to the scale parameter.
Q: Which measure would you use to explore the dispersion of your data? Choose all. variance mean mode…
A: We have given that, Which measure would you use to explore the dispersion of your data?
Q: Pregnant women (within month 4) who are being followed up by a nutritionist had weights (kg) equal…
A: Given that Pregnant women (within month 4) who are being followed up by a nutritionist had weights…
Q: mean: Sample standard deviation: Question Help: Read 1 Video 1 D Video 2 Submit Question
A: Here use following formula
Q: An article in a Journal reports that 34% of American fathers take no responsibility for childcare. A…
A:
Q: What kind of statistical test is this? a. Is the test statistically significant? How do you know? C.…
A: Since you have posted a question with multiple sub-parts, we will solve first three subparts for…
Q: The first quarterly assessment result of Grade 11- STEM students in their Statistics and Probability…
A:
Q: 26 randomly selected students were asked the number of movies they watched the previous week. #.…
A:
Q: This data is from a sample. Calculate the mean, standard deviation, and variance. Suggestion: use…
A: According to bartleby policy i have solved first three subparts of this question. i hope it will…
Q: Two samples of 6 and 5 items respectively gave the following data: Is the difference of mean…
A: We have given that Sample size n1= 6 , n2= 5 Sample mean xbar1 = 40 , xbar2 =50 Standard deviation…
Q: A recent study focused on the number of times men and women send a Twitter message in a day. The…
A: Given : A recent study focused on the number of times men and women send a Twitter message in a day.…
Q: a) Find the population standard deviation o. b) What is the required sample size if one wants the…
A: Here use MARGIN OF ERROR formula
Q: A producer claims that his potato chips weight is more than 150 grams. The weight of the bag has a…
A:
Q: The Wade Tract Preserve in Georgia is an old-growth forest of longleaf pines that has survived in a…
A: Obtain the 90% confidence interval for difference in the mean diameter at breast height between the…
Q: Answer the multiple choice. A sample of size 50 will be drawn from a population with mean 73 and…
A:
Q: A survey found that the average hotel room rates and standard deviations for the state of…
A: We want to find the p value
Q: Supplier Samplé šize Мeans Standard Deviation A 50 150 10 B 100 165 12 Test whether the difference…
A: n1 = 50 n2 = 100 x1 = 150 x2 = 165 s1=10 s2 = 12
Q: This data is from a sample. Calculate the mean, standard deviation, and coefficient of variation.…
A: Introduction: For a sample of n observations in a sample with values, say x1, x2, …, xn, the sample…
Q: A hospital in a large city records the weight of every infant born at the hospital. The distribution…
A: Solution
Q: The patient recovery time from a particular surgical procedure is normally distributed with a mean…
A: Consider a random variable X as the recovery time of a patient from a specific surgical process…
Q: To increase the Power of a test without changing the significance level A. Reduce the variance of…
A: The objective is to choose correct option for given problem.
Q: 18. Which of the following measures describes how spread out the data is from the mean? O median O…
A: To determine which of the following measures describes how spread out the data is from the mean.1…
Q: Overproduction of uric acid in the body can be an indication of cell breakdown. This may be an…
A: Note: Hi, thank you for the question. As per our company guideline we are supposed to answer only…
Q: Given the data below, test the hypothesis that job satisfaction (0 to 100 scale) is the same at…
A:
Q: otiva its? ch were administered a survey of attitudes toward Life upward mobility. The scores are…
A: Let xi; (i=1,2,...,n1) and yj; (j=1,2,...,n2) be the two independent samples with S12 and S22 sample…
Q: Which measure of spread is less affected by the addition of the extreme observation? A. Range B. IQR…
A: We have given that Data Xi : 25 25 37 58 65 69 70 71 86 87 We have to calculate Range, standard…
Q: compare ihe altenuance al lNe res for a Saturday evening performance. He knows the mean and standard…
A: a) From the provided information, Goodman’s mean (µ1) = 383 Standard deviation (σ1) = 34 Attendance…
Q: a. Compute the value of the variance. b. Determine the value of the standard deviation. C. Determine…
A: Since you have asked multiple questions, we will solve the first question for you. If you want any…
Q: Everest auto industry produces bearing for Mahindra Motor Corporation. The precision of radius of…
A: Hey there! Thank you for posting the question. Since you have posted a question with multiple…
Q: This data is from a sample. Calculate the mean, standard deviation, and coefficient of variation.…
A: 47.1 42.2 26.3 39.7 22.1 29 35.5 30.2 MEAN 34.0125 VAR…
Q: ASAP!! ANSWER According to the research conducted by the geologists of University of Texas, the…
A:
Q: You know the minimum and the maximum of a distribution. Which of the following measures of…
A: According to the given information, we have The minimum and the maximum of a distribution are given.
Q: (b) Determine the mean and standard deviation of the sample data. The mean of the sample data is…
A: Given Information:
Q: Use the normal distribution of SAT critical reading scores for which the mean is 514 and the…
A: GivenMean(μ)=514standard deviation(σ)=115
Q: What technique compares dispersion with the average of data? Select one: a. Standard deviation b.…
A: Measure of Dispersion: A central value can't provide the information about the scatter values of set…
Q: The number of reviews for each of the local restaurants is counted. The results are normally…
A:
Q: A survey found that the average hotel room rates and standard deviations for the state of Arkansas…
A:
Solve quickly please

Step by step
Solved in 4 steps with 3 images

- What is meant by the sample space of an experiment?The respiratory disturbance index (RDI), which is the number of apneic and hypopneic episodes per hour of sleep, was used as a measure of severity of sleep apnea. An RDI of 5 or more indicates sleep-related breathing disturbances. The RDIs for the females and males samples in a study in US are as follows. At the 1% significance level, do the data provide sufficient evidence to conclude that the female patients are less suffer than male from the apnea disease?When doing an ANOVA, you observe large differences in means between groups. Within the ANOVA framework, this would most likely be interpreted as evidence strongly favoring which hypothesis?
- The effects of two catalysts on the mean yield of a chemical process are being investigated.A test is conducted in the pilot plant, yielding the data reported in Table 1. Is there anydifference between the mean yields from the two catalyst at the 5% significance level?Assume the two population variances are equal.A paint manufacturer wishes to compare the drying times of two different types of paint. Independent random samples of 11 cans of type A and 9 cans of type B were selected and applied to similar surfaces. The drying times (in hours) were recorded. The summary statistics are given in the image below. Use a 0.01 significance level to test the claim that the mean drying time for paint type A is longer than the mean drying time for paint type B.In a study of the accuracy of fast food drive-through orders, one restaurant had 30 orders that were not accurate among 393 orders observed. Use a 0.05 significance level to test the claim that the rate of inaccurate orders is equal to 10%. Does the accuracy rate appear to be acceptable? Identify the test statistic for this hypothesis test.
- A random sample of 125 hypertensive and 150 normal senior citizens were asked if they read nutrition labels on food products. Results are presented below. (Check image) Is there an evidence of a significant difference between the proportions of hypertensive and normal senior citizens who read nutrition labels? Use a 5% level of significance.The method of selecting a significance level (alpha value) is different for an ANOVA True FalseA researcher looks at the mean salaries of male and female electricians and decides based on the evidence that there is no difference between the two groups. Given that there was a failure to reject the null hypothesis, it is possible that a type II error was made. Given the type of error made in this situation, what could researchers do to reduce the risk of this error? Choose a .01 significance level, instead of a .05 significance level. Increase the sample size.
- Do sit down restaurant franchises and fast food franchises differ significantly in stock price? Specifically, is the average stock price for sit-down restaurants different from the average stock price for fast food restaurants? A hypothesis test for two independent samples is run on data recorded from the stock exchange and a p-value is calculated to be 0.044. What is the appropriate conclusion?What is equation for STANDARDIZED EFFECT SIZE, COHEN’S d (ADAPTED FOR ANOVA)?This is an exercise. Based on the given photo, test the hypothesis that the model is VALID or WELL-SPECIFIED at the 1% significance level. Why? Please, ASAP. Thank you.