What are the answers for these questions? 1.Why is it necessary that the oil bath/water bath is stirred while heating? 2.Why are there bubbles escaping from the open end of the capillary tube during boiling? 3.What is the importance of collecting more than one drop of the liquid sample from the burette?
What are the answers for these questions? 1.Why is it necessary that the oil bath/water bath is stirred while heating? 2.Why are there bubbles escaping from the open end of the capillary tube during boiling? 3.What is the importance of collecting more than one drop of the liquid sample from the burette?

Chapter82: Physical Constants Of Liquids: The Boiling Point And Density
Section: Chapter Questions
Problem 5P

Related questions

Question
What are the answers for these questions?
1.Why is it necessary that the oil bath/water bath is stirred while heating?
2.Why are there bubbles escaping from the open end of the capillary tube during boiling?
3.What is the importance of collecting more than one drop of the liquid sample from the burette?
4.Based on the boiling point and surface tension values obtained, which of the two liquids has stronger IMFA?
Transcribed Image Text:1.4
0.60220
0.59833
0.59448
0.59069
0.58694
0.58326
0.57963
0.57608
0.57260
0.56918
1.5
0.56583
0.56253
0.55929
0.55609
0.55292
0.54977
0.54662
0.54346
0.54027
0.53702
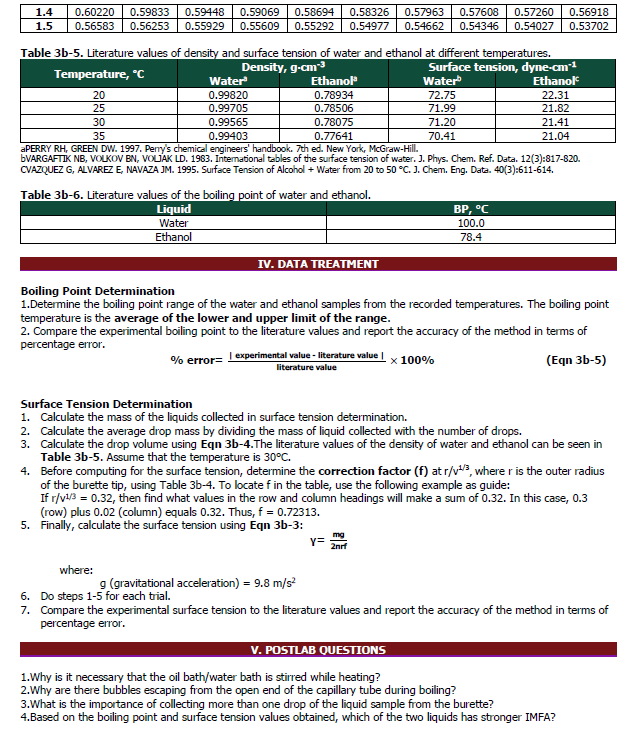
Table 3b-5. Literature values of density and surface tension of water and ethanol at different temperatures.
Surface tension, dyne-cm1
Ethanol
Density, g-cm
Temperature, °C
Water
Ethanol
Water
0.99820
0.99705
0.99565
20
0.78934
72.75
22.31
71.99
71.20
25
0.78506
21.82
21.41
30
0.78075
0.77641
35
0.99403
70.41
21.04
aPERRY RH, GREEN DW. 1997. Pery's chemical engineers' handbook. 7th ed. New York, McGraw-Hill.
ÞVARGAFTIK NB, VOLKOV BN, VOLJAK LD. 1983. Intermational tables of the surface tension of water. J. Phys. Chem. Ref. Data. 12(3):817-820.
CVAZQUEZ G, ALVAREZ E, NAVAZA JM. 1995. Surface Tension of Alcohol + Water from 20 to 50 °C. J. Chem. Eng. Data. 40(3):611-614.
Table 3b-6. Literature values of the boiling point of water and ethanol.
Liquid
BP, °C
100.0
Water
Ethanol
78.4
IV. DATA TREATMENT
Boiling Point Determination
1.Determine the boiling point range of the water and ethanol samples from the recorded temperatures. The boiling point
temperature is the average of the lower and upper limit of the range.
2. Compare the experimental boiling point to the literature values and report the accuracy of the method in terms of
percentage error.
0% error= Texperimental value - literature value |x 100%
(Eqn 3b-5)
literature value
Surface Tension Determination
1. Calculate the mass of the liquids collected in surface tension determination.
2. Calculate the average drop mass by dividing the mass of liquid collected with the number of drops.
3. Calculate the drop volume using Egn 3b-4.The literature values of the density of water and ethanol can be seen in
Table 3b-5. Assume that the temperature is 30°C.
4. Before computing for the surface tension, determine the correction factor (f) at r/v3, where r is the outer radius
of the burette tip, using Table 3b-4. To locate f in the table, use the following example as guide:
If r/v3 = 0.32, then find what values in the row and column headings will make a sum of 0.32. In this case, 0.3
(row) plus 0.02 (column) equals 0.32. Thus, f = 0.72313.
5. Finally, calculate the surface tension using Egn 3b-3:
mg
Y=
2nrf
where:
g (gravitational acceleration) = 9.8 m/s?
6. Do steps 1-5 for each trial.
7. Compare the experimental surface tension to the literature values and report the accuracy of the method in terms of
percentage error.
V. POSTLAB QUESTIONS
1.Why is it necessary that the oil bath/water bath is stirred while heating?
2.Why are there bubbles escaping from the open end of the capillary tube during boiling?
3.What is the importance of collecting more than one drop of the liquid sample from the burette?
4.Based on the boiling point and surface tension values obtained, which of the two liquids has stronger IMFA?
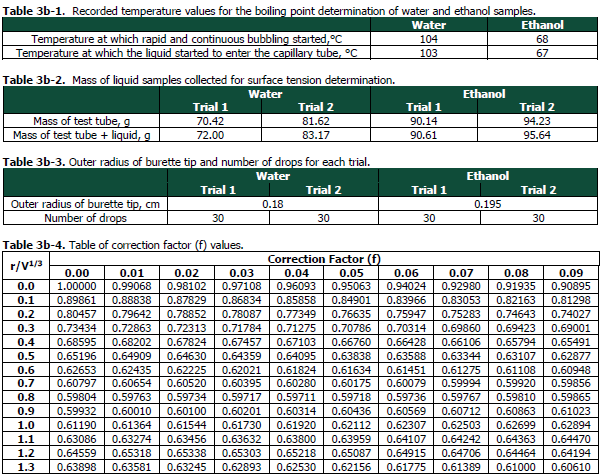
Transcribed Image Text:Table 3b-1. Recorded temperature values for the boiling point determination of water and ethanol samples.
Ethanol
Water
Temperature at which rapid and continuous bubbling started,°C
Temperature at which the liquid started to enter the capillary tube, °C
104
68
103
67
Table 3b-2. Mass of liquid samples collected for surface tension determination.
Water
Ethanol
Trial 1
Trial 2
Trial 1
Trial 2
Mass of test tube, g
Mass of test tube + liquid, g
81.62
83.17
70.42
90.14
94.23
72.00
90.61
95.64
Table 3b-3. Outer radius of burette tip and number of drops for each trial.
Water
Ethanol
Trial 1
Trial 2
Trial 1
Trial 2
Outer radius of burette tip, cm
Number of drops
0.18
0.195
30
30
30
30
Table 3b-4. Table of correction factor (f) values.
Correction Factor (f)
0.04
0.96093
r/V1/3
0.00
1.00000
0.01
0.02
0.03
0.05
0.06
0.07
0.08
0.09
0.0
0.99068
0.98102
0.97108
0.95063
0.94024
0.92980
0.91935
0.90895
0.1
0.89861
0.88838
0.87829
0.86834
0.85858
0.77349
0.84901
0.83966
0.83053
0.82163
0.81298
0.2
0.80457
0.79642
0.78852
0.78087
0.76635
0.70786
0.66760
0.63838
0.75947
0.75283
0.74643
0.74027
0.3
0.73434
0.72863
0.72313
0.71784
0.71275
0.70314
0.69860
0.69423
0.69001
0.65491
0.4
0.68595
0.68202
0.67824
0.67457
0.66428
0.67103
0.64095
0.66106
0.63344
0.65794
0.5
0.65196
0.62653
0.64909
0.64630
0.64359
0.63588
0.63107
0.62877
0.6
0.62435
0.62225
0.62021
0.61824
0.61634
0.61451
0.61275
0.61108
0.60948
0.7
0.60797
0.60654
0.60520
0.60395
0.60280
0.60175
0.60079
0.59994
0.59920
0.59856
0.8
0.59804
0.59763
0.59734
0.59717
0.59711
0.59718
0.60436
0.59736
0.59767
0.59810
0.59865
0.9
0.59932
0.60010
0.60100
0.60201
0.60314
0.60569
0.60712
0.60863
0.61023
0.62894
0.64470
0.64194
1.0
0.61190
0.63086
0.64559
0.61364
0.61544
0.61730
0.61920
0.62112
0.62307
0.62503
0.62699
0.63274
0.65318
0.63632
0.64107
0.64915
1.1
0.63456
0.63800
0.64242
0.63959
0.65087
0.64363
0.64464
1.2
0.65338
0.63245
0.65303
0.65218
0.64706
1.3
0.63898
0.63581
0.62893
0.62530
0.62156
0.61775
0.61389
0.61000
0.60610
I
...
Expert Solution
This question has been solved!
Explore an expertly crafted, step-by-step solution for a thorough understanding of key concepts.

This is a popular solution!

Trending now
This is a popular solution!

Step by step
Solved in 3 steps

Knowledge Booster


Learn more about
Need a deep-dive on the concept behind this application? Look no further. Learn more about this topic, chemistry and related others by exploring similar questions and additional content below.Recommended textbooks for you
EBK A SMALL SCALE APPROACH TO ORGANIC L
Chemistry
ISBN:
9781305446021
Author:
Lampman
Publisher:
CENGAGE LEARNING - CONSIGNMENT

Macroscale and Microscale Organic Experiments
Chemistry
ISBN:
9781305577190
Author:
Kenneth L. Williamson, Katherine M. Masters
Publisher:
Brooks Cole
EBK A SMALL SCALE APPROACH TO ORGANIC L
Chemistry
ISBN:
9781305446021
Author:
Lampman
Publisher:
CENGAGE LEARNING - CONSIGNMENT
Macroscale and Microscale Organic Experiments
Chemistry
ISBN:
9781305577190
Author:
Kenneth L. Williamson, Katherine M. Masters
Publisher:
Brooks Cole