
Biology 2e
2nd Edition
ISBN:9781947172517
Author:Matthew Douglas, Jung Choi, Mary Ann Clark
Publisher:Matthew Douglas, Jung Choi, Mary Ann Clark
Chapter30: Plant Form And Physiology
Section: Chapter Questions
Problem 19RQ: When stomata open, what occurs?______ Water vapor is lost to the external environment, increasing...

Related questions

Concept explainers
Question
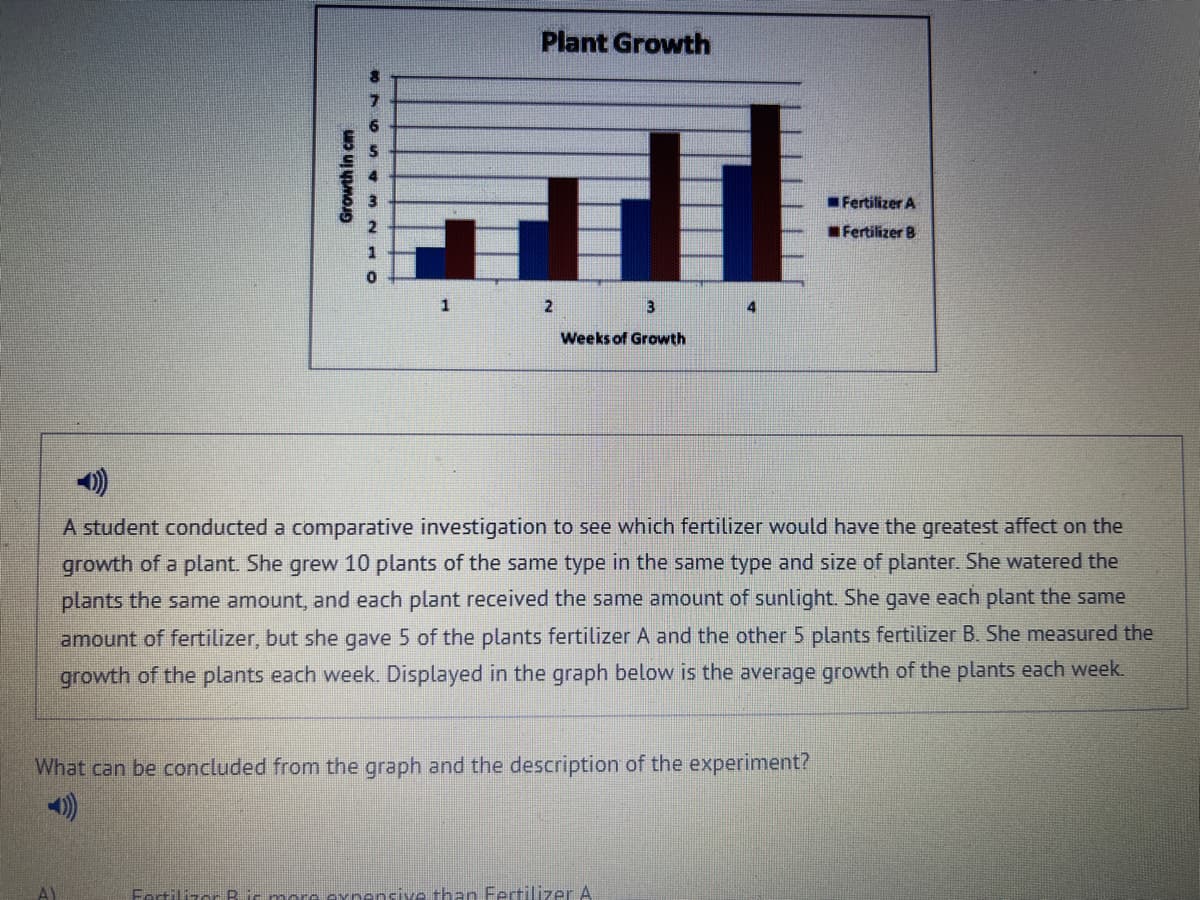
What can be concluded from the graph and the description of the experiment?
A) fertilizer b is more expensive than fertilizer a
B) fertilizer a has a slower growth rate effect on the plants compared to fertilizer b
C) plants using fertilizer a were located further away from windows where sunlight was present
D) during a four week period, the plants with fertilizer b received more water than the plants with fertilizer a
Transcribed Image Text:Growth in cm
OHNW 00
6
Plant Growth
ull
T
1
2
3
Weeks of Growth
A student conducted a comparative investigation to see which fertilizer would have the greatest affect on the
growth of a plant. She grew 10 plants of the same type in the same type and size of planter. She watered the
plants the same amount, and each plant received the same amount of sunlight. She gave each plant the same
amount of fertilizer, but she gave 5 of the plants fertilizer A and the other 5 plants fertilizer B. She measured the
growth of the plants each week. Displayed in the graph below is the average growth of the plants each week.
What can be concluded from the graph and the description of the experiment?
Fertilizer A
Fertilizer B
Fertilizer B is more expensive than Fertilizer A
Expert Solution
This question has been solved!
Explore an expertly crafted, step-by-step solution for a thorough understanding of key concepts.

This is a popular solution!

Trending now
This is a popular solution!

Step by step
Solved in 3 steps

Knowledge Booster


Learn more about
Need a deep-dive on the concept behind this application? Look no further. Learn more about this topic, biology and related others by exploring similar questions and additional content below.Recommended textbooks for you
Biology 2e
Biology
ISBN:
9781947172517
Author:
Matthew Douglas, Jung Choi, Mary Ann Clark
Publisher:
OpenStax

Biology: The Dynamic Science (MindTap Course List)
Biology
ISBN:
9781305389892
Author:
Peter J. Russell, Paul E. Hertz, Beverly McMillan
Publisher:
Cengage Learning

Biology 2e
Biology
ISBN:
9781947172517
Author:
Matthew Douglas, Jung Choi, Mary Ann Clark
Publisher:
OpenStax
Biology: The Dynamic Science (MindTap Course List)
Biology
ISBN:
9781305389892
Author:
Peter J. Russell, Paul E. Hertz, Beverly McMillan
Publisher:
Cengage Learning

Biology: The Unity and Diversity of Life (MindTap…
Biology
ISBN:
9781305073951
Author:
Cecie Starr, Ralph Taggart, Christine Evers, Lisa Starr
Publisher:
Cengage Learning

Biology (MindTap Course List)
Biology
ISBN:
9781337392938
Author:
Eldra Solomon, Charles Martin, Diana W. Martin, Linda R. Berg
Publisher:
Cengage Learning