What factor is considered in the experiment? (4 decimal)
Q: STATISTICS AND PROBABILITY (Answer only. NO long explanation needed. Rate will be given) Which of…
A: The given graph is normal probability distribution. The probability density curve of normal…
Q: 190 150 195 163 210 140 180 156 200 148 143 124 149 125 240 170 158 133 235 165 169 135 192 160 170…
A: *Answer: Step 2 A) The general form of regression line is given as: y=a+bx where a is the…
Q: Class Interval 144-149 138-143 132-137 126-131 102 - 125 114-119 108-113 102-107 96 - 101 90-95…
A: Find D8 =?
Q: A FREQUENCY DISTRIBUTION TABLE is a tabulated form of data consisting of two columns-class intervals…
A: To construct the frequency distribution table.
Q: Does the table show a probability distribution? Select all that apply. A. Yes, the table shows a…
A: The provided information is x p(x) x*p(x) x2*p(x) 0 0.662 0 0 1 0.281 0.281 0.281 2 0.052…
Q: 4.7 Consider the simple linear regression model fit to the weight and blood pressure data in.…
A: Residual explain the error happen in the data set. It is calculated by the difference of actual and…
Q: MAK 1. The personal office at a large electronics firm regularly schedules job interviews and…
A: Given that mean = 34 ,s.d =7 ,n =9
Q: If 3 books are picked at random from a shelf containing 5 novels, 3 books of poems and a dictionary,…
A:
Q: Two suppliers manufacture a plastic gear used in a laser printer. The impact strength of these gears…
A: From the given information we conduct Hypothesis test.
Q: The weight and systolic blood pressure of 26 randomly selected males in the age group 25 to 30 are…
A: The independent variable is Weight. The dependent variable is Systolic BP. We have to find the…
Q: Q3 / The following is a recurring distribution of the ages of a number of workers in the Oil…
A: Mode is a measure of central tendency. It gives the value with highest frequency. In other words.…
Q: What is the standard error of the sample mean if your sample size is 36? Give your answer to 2…
A: It is given that Population standard deviation, σ = 4.8 Sample mean, x̅ = 25.9 Sample standard…
Q: Mr. and Mrs. Brown were married last October 2021 in Ocean view of Nahant in Massachusetts, USA.…
A: Given that, Mr. and Mrs. Brown were planning to have 3 children. If none of the 3 is a boy, they…
Q: PROBLEM 7: Assume that the mean height for women at a large university (to be viewed as a…
A: It is given that Mean, μ = 65 Standard deviation, σ = 3 Sample size, n = 36 Note: According to…
Q: Data Management - Statistical Anaylsis Per the following graph, explain the reason for every…
A: Given Information: Consider the given graph that shows the status of the Covid case reported. The…
Q: 3.- [ each] Identify the type(s) of bias in the sampling method (sampling, nonresponse, response) a)…
A: Bias is the error that occurred in the observation. Error occurred in the data set may leads to…
Q: Two machines are used for filling plastic bottles with a net volume of 16.0 ounces. The fill volume…
A: Critical Values are the cut-off values that provide with the regions in which the test statistic is…
Q: The weight and systolic blood pressure of 26 randomly selected males in the age group 25 to 30 are…
A: Solution First we will calculate the sum of squares.
Q: You answered this question: What is the Sample Variance for the following numbers: 52, 62, 52, 45,…
A: Given52, 62, 52, 45, 41
Q: The correlation for this data is r = -0.8111. Which is the correct interpretation of this value?…
A: It is given that the two variables sea surface temperatures and coral growth per year at locations…
Q: A population has a mean u 90 and a standard deviation a 18. Find the mean and standard deviation of…
A: The mean is 90 and the standard deviation is 18.
Q: A new college needs to pick a mascot for its basketball team. The students were asked to rank four…
A:
Q: 6.1 2) A college professor decided to examine whether or not there is a relationship between the…
A: Scatter graph is a type of graph that depicts the relationship between the two variables. There are…
Q: A. Compute for Coefficient of r Let x ΣΥ Ξ [x² = Y n= [x = [xy = £y = r= Analysis & Interpretation…
A: Solution-: Let, X=Weight (lbs) and Y=Chest size (cm) We have following data: X Y 5.64 29.5…
Q: As the new manager of a small convenience store, you want to understand the shopping patterns of…
A: Given data is :
Q: 4.6 Consider the simple linear regression model fi t to the oxygen purity data. Hydrocarbon (%)…
A:
Q: Which percentage is the best estimate for the shaded area under this normal curve?
A: From given curve, Mean = -20 And SD = 10 Let X denote the distribution. Given that X follows N(mean…
Q: The time needed by a person to sort wet and dry wastes is to be determined so that it can be used as…
A: Given Information: Variable of interest=Time to segregate dry and wet wasteN=25Unit of…
Q: STATISTICS AND PROBABILITY (Answer only. NO long explanation needed. Rate will be given) ANSWER IN…
A: A) P(Z<-----)=0.0973........(1) From the z table, P(Z<-1.2971)=0.0973.......(2) By comparing…
Q: Which describes a normal distribution with mean u and variance σ²? Its mode and median are both…
A: It is given that the normal distribution with mean μ and variance σ2. Here, need to find out the…
Q: the tampa bay (florida) area chamber of commerce wanted to know wheither the mean weekly salary of…
A: Given that: School teacher sample data: 1095 1075 1077 1125 1034 1059 1052 1070…
Q: 9. Two years ago 72% of household in a certain city regularly participated in recycling household…
A: “Since you have posted multiple question , we will solve first question for you. To get the…
Q: 5.3 2) At the local veterinarian school, the number of animals treated each day over a period of 20…
A: For the given data Construct stem and leaf plot Describe center,shape,outlier and spread
Q: 7. The chart represents the average amount of rain falling each month in the town of Mabini. During…
A: January-12 inches April-5 inches August-3 inches December-10 inches
Q: Ex/ Let x₁ Ho : 4 =1 X/Q = find. LRT (X=0.05) --X15 (6) + (x) = 1 H₁14=5
A: Given that We have to find LRT :
Q: Consider the hypothesis test Ho: o2 = 02 against H₁: o² <o2 respectively. Suppose that the sample…
A: We need to test the hypothesis: Ho : σ12 = σ22 Ha : σ12 < σ22
Q: 3P40 -50 = 0.98, 2P43 = 0.97, dx = 0.09387 45
A: Given p403=0.98 p432=0.97 ∫4550μx dx=0.09387
Q: Q1. A pharmaceutical manufacturer is concerned about the impurity concentration in batches of drug…
A: Given data: Significance level = 0.05
Q: For the following information please answer both questions below: The median for an assignment…
A: Solution-; Given: Median=84%,σ=6% We want find, (a) What score on the assignment would you expect…
Q: 2. Suppose the PMF of the random variable X is px(x) =p(1-p)*(0,1...(x) where p is a constant…
A:
Q: researcher selects a sample and administers a treatment for anxiety to the individuals in the…
A: We have given that A researcher selects a sample and administers a treatment for anxiety to the…
Q: D. A report five years ago sla state were "deficient." An advocacy group took a random sample of 100…
A:
Q: Mr Martin can drive to work along four different routes. The following are the number of minutes the…
A: State the hypotheses: Null hypothesis: H0:µ1 = µ2 = µ3 Alternative hypothesis: H0: Not all the…
Q: The share prices of a company in Mumbai and Kolkata markets during the last 10 months are recorded…
A: The question is about spread of data Given :
Q: Research reported the results of a study on the occurrence of oxygen and chloride in surface streams…
A: The dependent variable y is chloride concentration and the independent variable x is roadway area in…
Q: #3. Choose the letter of the correct answer. An ogive is a graphical representation of a. Cumulative…
A: The objective is to find the correct option from the given choices.
Q: What does it mean if the support for rule (milk, cheese -> apples) is 35%? O a. given a set of all…
A: In data mining, rule is used to analyze and predict customer behavior. The two parts of rule are…
Q: mking 11. Suppose Google creates a new workspace in Toronto. The building operates with 1,200…
A:
Q: Determine whether each of the following statements is true or false. Explain the answer for each.…
A: The objective is to determine whether the given statements are true or false.
Q: Median square feet 8.- The scatterplot and the model compares the years and the median square…
A: Given: Sample size n = 8 Formula Used: The equation of linear model is: Y = a + bX Where, a is…
7. What factor is considered in the experiment? (4 decimal)
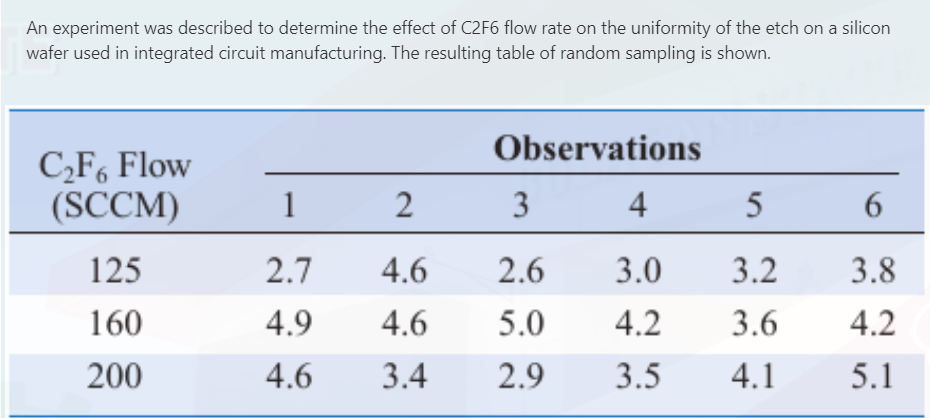
Step by step
Solved in 2 steps