What grade level had the smallest number of participants? O The answer is not indicated in the article. O I'm not sure how to address this problem...yet. O Grade 7 O Grade 8 O Grade 6 2. how many of the 508 students were female ?round your answer to the nearest whole number O235 O272 O I'm not sure how to address this problem...yet. O 259 O 230 O 241 3.As a percent of the sample how many more sixth graders are there than seventh ? also, as a whole number, how many more sixth graders are there than seventh graders? O 1% more; 20 more 6th Graders O I'm not sure how to address this problem....yet. O 3% more; 15 more 6th Graders O 5% more; 30 more 6th Graders O 2% more; 18 more 6th Graders O 5% more; 32 more 6th Graders O 5% more: 26 more 6th Graders Of the six categories of health-risk behaviors in Table 1 found in the article, which category was
What grade level had the smallest number of participants? O The answer is not indicated in the article. O I'm not sure how to address this problem...yet. O Grade 7 O Grade 8 O Grade 6 2. how many of the 508 students were female ?round your answer to the nearest whole number O235 O272 O I'm not sure how to address this problem...yet. O 259 O 230 O 241 3.As a percent of the sample how many more sixth graders are there than seventh ? also, as a whole number, how many more sixth graders are there than seventh graders? O 1% more; 20 more 6th Graders O I'm not sure how to address this problem....yet. O 3% more; 15 more 6th Graders O 5% more; 30 more 6th Graders O 2% more; 18 more 6th Graders O 5% more; 32 more 6th Graders O 5% more: 26 more 6th Graders Of the six categories of health-risk behaviors in Table 1 found in the article, which category was

Glencoe Algebra 1, Student Edition, 9780079039897, 0079039898, 2018
18th Edition
ISBN:9780079039897
Author:Carter
Publisher:Carter
Chapter10: Statistics
Section10.6: Summarizing Categorical Data
Problem 30PPS

Related questions
Question
1. What grade level had the smallest number of participants?
O The answer is not indicated in the article. O I'm not sure how to address this problem...yet.
O Grade 7
O Grade 8
O Grade 6
2. how many of the 508 students were female ?round your answer to the nearest whole number
O235
O272
O I'm not sure how to address this problem...yet.
O 259
O 230
O 241
3.As a percent of the sample how many more sixth graders are there than seventh ? also, as a whole number, how many more sixth graders are there than seventh graders?
O 1% more; 20 more 6th Graders
O I'm not sure how to address this problem....yet.
O 3% more; 15 more 6th Graders
O 5% more; 30 more 6th Graders
O 2% more; 18 more 6th Graders
O 5% more; 32 more 6th Graders
O 5% more: 26 more 6th Graders
Of the six categories of health-risk behaviors in Table 1 found in the article, which category was reported most often by the NSSI group?
O Had sexual intercourse in the past year involving drinking or using drugs beforehand
O I'm not sure how to address this problem...yet.
O Ever used drugs to get high
O Binged in the past year
O Smoked cigarettes in the past year
O Describe self as overweight
O Fasted to lose weight or keep from gaining weight in the past month
Please respond to the following statement with either True or False: "The NSSI group has higher percentages in all six categories than the non-NSSI group.
O True
O False
What is the percentage difference between the two groups for "Ever used drugs to get
high"?
O 66.3%
O 82.1%
O 42.3 %
O I'm not sure how to address this problem...yet.
O 63.2%
O 72.9%
O 51.5%
What number of participants in the NSSI group reported they smoked cigarettes in the past year? (Round your answer to the nearest whole number).
O 35
O 39
O 36
O I'm not sure how to address this problem...yet.
O 37
38
O 34
What number of participants in the non-NSSI group reported they smoked cigarettes
in the past year? (Round your answer to the nearest whole number).
O 80
O 129
O 85
O I'm not sure how to address this problem....yet.
O 92
O 50
O 115
In terms of numbers of participants, did more students in the NSSI group or more of the students in the non-NSSI group report having binged in the past year?
ONSSI
O I'm not sure how to address this problem...yet.
O non-NSSI
O It cannot be determined by the information provided in the article.
For the non-NSSI group, the percentages in Table 1 sum up to more than 100%. Which of the following could explain how this is possible.
O Participants did not follow directions.
O Participants can choose more than one category.
O I'm not sure how to address this problem....yet.
O It is possible to always sum up beyond 100% no matter the context of the problem
PLEASE HELP IM PAYING FOR THIS APPP
Transcribed Image Text:1. Upon reading the excerpt below, take the Factual Quiz on Canvas.
2. Then answer one of the prompts below on the Online Discussion Board. Be sure to respond to
94
Article #1 on Percent
Instructions
at least two peers' comments
Non-suicidalSelf-Injury
Longitudinal study of non-suicidal self-injury among young adolescents: Rates, correlates, and
preliminary test of an interpersonal model.
EXCERPT FROM THE RESEARCH ARTICLE
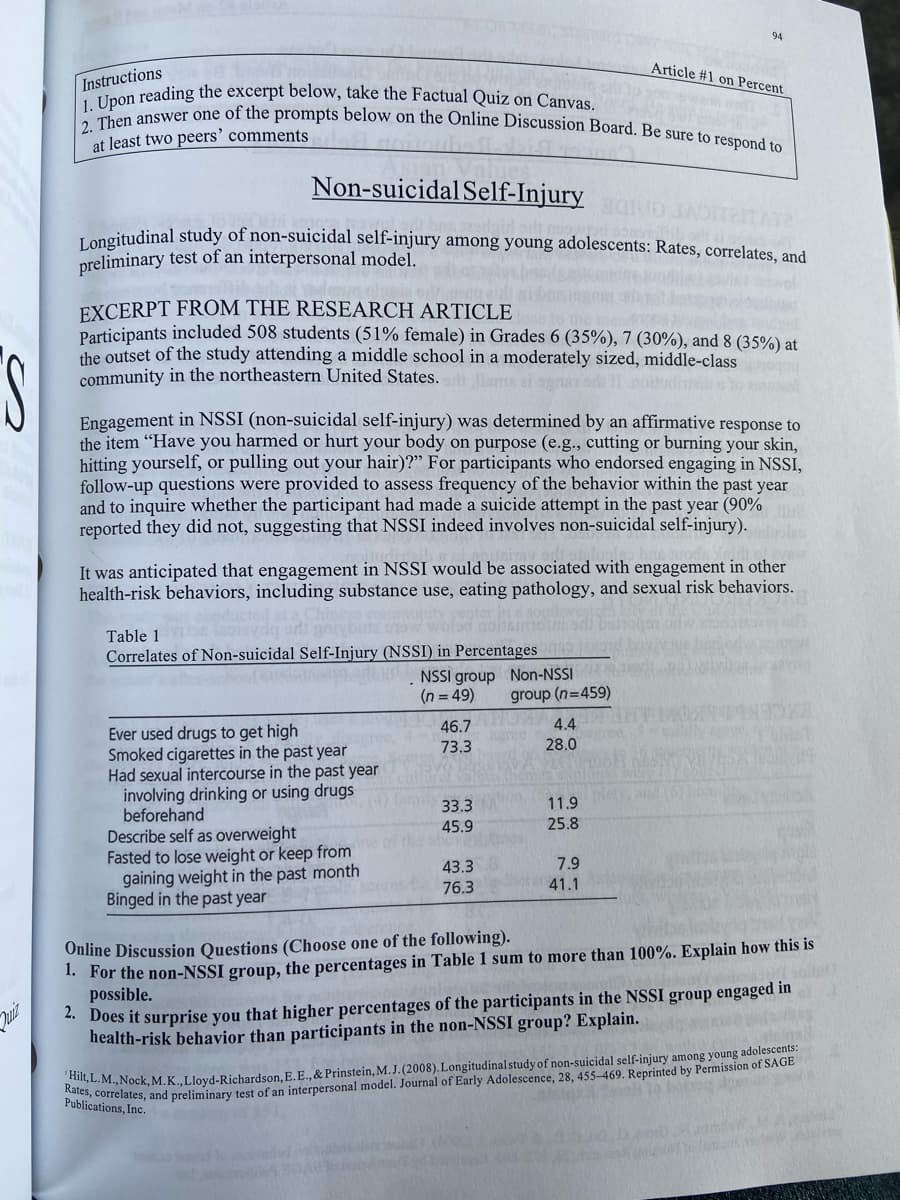
Participants included 508 students (51% female) in Grades 6 (35%), 7 (30%), and 8 (35%) at
the outset of the study attending a middle school in a moderately sized, middle-class
community in the northeastern United States. e i en
Engagement in NSSI (non-suicidal self-injury) was determined by an affirmative response to
the item "Have you harmed or hurt your body on purpose (e.g., cutting or burning your skin,
hitting yourself, or pulling out your hair)?" For participants who endorsed engaging in NSSI,
follow-up questions were provided to assess frequency of the behavior within the past year
and to inquire whether the participant had made a suicide attempt in the past year (90%
reported they did not, suggesting that NSSI indeed involves non-suicidal self-injury).
It was anticipated that engagement in NSSI would be associated with engagement in other
health-risk behaviors, including substance use, eating pathology, and sexual risk behaviors.
Table 1
Correlates of Non-suicidal Self-Injury (NSSI) in Percentages
NSSI group Non-NSSI
group (n=459)
A4.4
(n = 49)
46.7
Ever used drugs to get high
Smoked cigarettes in the past year
Had sexual intercourse in the past year
involving drinking or using drugs
beforehand
Describe self as overweight
Fasted to lose weight or keep from
gaining weight in the past month
Binged in the past year
73.3
28.0
33.3
11.9
25.8
45.9
ofthe above
43.3
7.9
76.3
41.1
Online Discussion Questions (Choose one of the following).
1. For the non-NSSI group, the percentages in Table 1 sum to more than 100%. Explain how this is
possible.
4. Does it surprise you that higher percentages of the participants in the NSSI group engaged in
health-risk behavior than participants in the non-NSSI group? Explain.
BaL. M., Nock, M.K., Llovd-Richardson. E.E., & Prinstein, M.J.(2008). Longitudinal study of non-suicidal self-injury among young adolescents:
Publicasrelates, and preliminary test of an interpersonal model. Journal of Early Adolescence, 28, 455–469, Reprinted by Permission of SAGE
Expert Solution
This question has been solved!
Explore an expertly crafted, step-by-step solution for a thorough understanding of key concepts.

This is a popular solution!

Trending now
This is a popular solution!

Step by step
Solved in 2 steps

Recommended textbooks for you
Glencoe Algebra 1, Student Edition, 9780079039897…
Algebra
ISBN:
9780079039897
Author:
Carter
Publisher:
McGraw Hill
Glencoe Algebra 1, Student Edition, 9780079039897…
Algebra
ISBN:
9780079039897
Author:
Carter
Publisher:
McGraw Hill