What hypotheses should be tested? Make sure to select the hypotheses which are written with notation consistent with the type of samples selected. 0 = Prl :°H H = Int:°H_0= Prt :°H in = In:°H_ = In1:°H_0 = Prl:°H Ha:Hd > 0 Hạ:µ1 # 42 Ha:4 > H2 H.: Ha < 0 H.:Hi < Hz HaiHd # 0 a = TS: t (round to 3 decimal places)
What hypotheses should be tested? Make sure to select the hypotheses which are written with notation consistent with the type of samples selected. 0 = Prl :°H H = Int:°H_0= Prt :°H in = In:°H_ = In1:°H_0 = Prl:°H Ha:Hd > 0 Hạ:µ1 # 42 Ha:4 > H2 H.: Ha < 0 H.:Hi < Hz HaiHd # 0 a = TS: t (round to 3 decimal places)

Glencoe Algebra 1, Student Edition, 9780079039897, 0079039898, 2018
18th Edition
ISBN:9780079039897
Author:Carter
Publisher:Carter
Chapter10: Statistics
Section10.3: Measures Of Spread
Problem 1GP

Related questions
Topic Video
Question
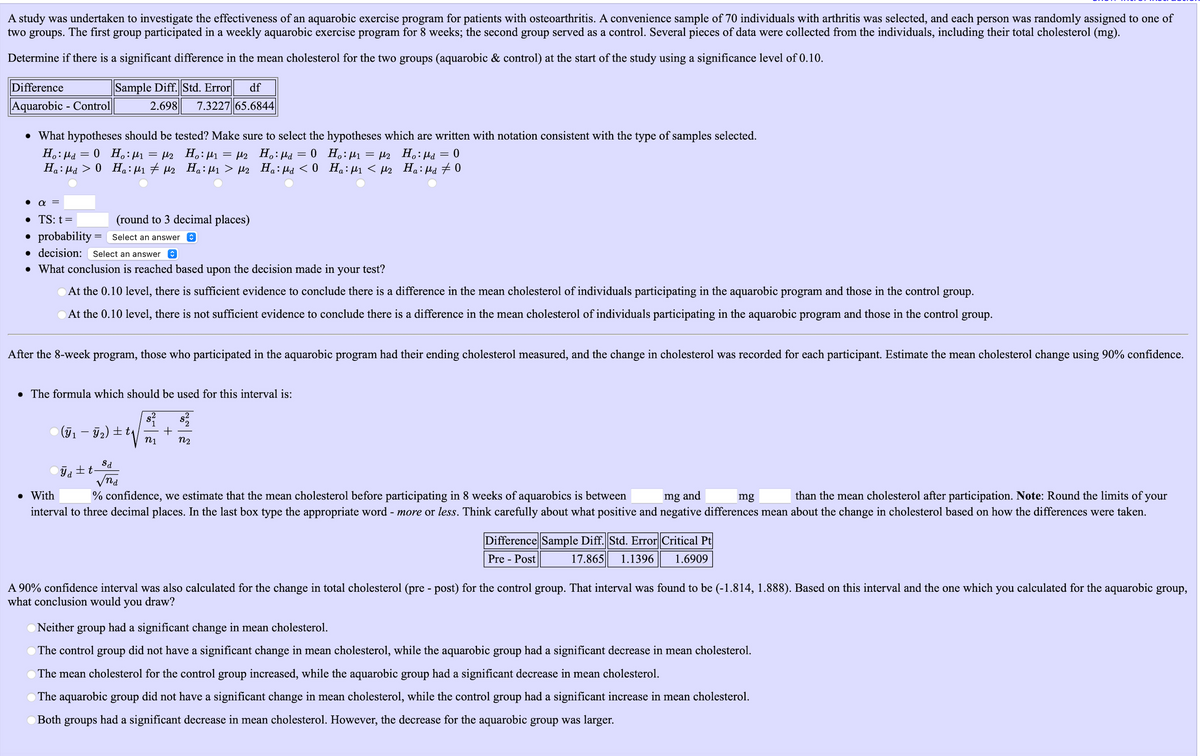
Transcribed Image Text:A study was undertaken to investigate the effectiveness of an aquarobic exercise program for patients with osteoarthritis. A convenience sample of 70 individuals with arthritis was selected, and each person was randomly assigned to one of
two groups. The first group participated in a weekly aquarobic exercise program for 8 weeks; the second group served as a control. Several pieces of data were collected from the individuals, including their total cholesterol (mg).
Determine if there is a significant difference in the mean cholesterol for the two groups (aquarobic & control) at the start of the study using a significance level of 0.10.
Difference
Sample Diff. Std. Error
df
Aquarobic - Control
2.698
7.3227 65.6844
• What hypotheses should be tested? Make sure to select the hypotheses which are written with notation consistent with the type of samples selected.
H.: µd
= l2 H.: µ1 = µ2 H.:µd
H.: Hd > 0 Ha: H1 # H2 Ha:µ1 > µ2 Ha:Hd < 0 Ha:H1 < µs Ha: Hd # 0
= 0 H,:µ1
0 H.: µ1 = µ2 H.: µd
• TS: t=
(round to 3 decimal places)
• probability = Select an answer e
• decision: Select an answer
• What conclusion is reached based upon the decision made in
your
test?
At the 0.10 level, there is sufficient evidence to conclude there is a difference in the mean cholesterol of individuals participating in the aquarobic program and those in the control group.
At the 0.10 level, there is not sufficient evidence to conclude there is a difference in the mean cholesterol of individuals participating in the aquarobic program and those in the control group.
After the 8-week program, those who participated in the aquarobic program had their ending cholesterol measured, and the change in cholesterol was recorded for each participant. Estimate the mean cholesterol change using 90% confidence.
• The formula which should be used for this interval is:
(71 – 72) ± t|
n1
n2
Sa
土t
Vnd
• With
than the mean cholesterol after participation. Note: Round the limits of your
interval to three decimal places. In the last box type the appropriate word - more or less. Think carefully about what positive and negative differences mean about the change in cholesterol based on how the differences were taken.
% confidence, we estimate that the mean cholesterol before participating in 8 weeks of aquarobics is between
mg and
mg
Difference Sample Diff. Std. Error Critical Pt|
Pre - Post
17.865
1.1396
1.6909
A 90% confidence interval was also calculated for the change in total cholesterol (pre - post) for the control group. That interval was found to be (-1.814, 1.888). Based on this interval and the one which you calculated for the aquarobic group,
what conclusion would
you
draw?
Neither
group
had a significant change in mean cholesterol.
The control group did not have a significant change in mean cholesterol, while the aquarobic group had a significant decrease in mean cholesterol.
The mean cholesterol for the control group increased, while the aquarobic group had a significant decrease in mean cholesterol.
O The aquarobic group did not have a significant change in mean cholesterol, while the control group had a significant increase in mean cholesterol.
Both
groups
had a significant decrease in mean cholesterol. However, the decrease for the aquarobic group was larger.
Expert Solution
This question has been solved!
Explore an expertly crafted, step-by-step solution for a thorough understanding of key concepts.

Step by step
Solved in 2 steps with 2 images

Knowledge Booster


Learn more about
Need a deep-dive on the concept behind this application? Look no further. Learn more about this topic, statistics and related others by exploring similar questions and additional content below.Recommended textbooks for you
Glencoe Algebra 1, Student Edition, 9780079039897…
Algebra
ISBN:
9780079039897
Author:
Carter
Publisher:
McGraw Hill

Holt Mcdougal Larson Pre-algebra: Student Edition…
Algebra
ISBN:
9780547587776
Author:
HOLT MCDOUGAL
Publisher:
HOLT MCDOUGAL

College Algebra (MindTap Course List)
Algebra
ISBN:
9781305652231
Author:
R. David Gustafson, Jeff Hughes
Publisher:
Cengage Learning
Glencoe Algebra 1, Student Edition, 9780079039897…
Algebra
ISBN:
9780079039897
Author:
Carter
Publisher:
McGraw Hill
Holt Mcdougal Larson Pre-algebra: Student Edition…
Algebra
ISBN:
9780547587776
Author:
HOLT MCDOUGAL
Publisher:
HOLT MCDOUGAL
College Algebra (MindTap Course List)
Algebra
ISBN:
9781305652231
Author:
R. David Gustafson, Jeff Hughes
Publisher:
Cengage Learning