Detergent manufacturers frequently make claims about effectiveness of their product. A consumer-protection service decided to test the five best selling brands of detergent in three water temperatures on their claim of producing the “whitest whites”. One hundred and fifty white sheets were equally soiled. Thirty sheets were washed in each of the five brands; 10 in cold water, 10 in warm water and 10 in hot water. After washing, the “whiteness” was measured with laser equipment. Perform the appr


Correlation
Correlation defines a relationship between two independent variables. It tells the degree to which variables move in relation to each other. When two sets of data are related to each other, there is a correlation between them.
Linear Correlation
A correlation is used to determine the relationships between numerical and categorical variables. In other words, it is an indicator of how things are connected to one another. The correlation analysis is the study of how variables are related.
Regression Analysis
Regression analysis is a statistical method in which it estimates the relationship between a dependent variable and one or more independent variable. In simple terms dependent variable is called as outcome variable and independent variable is called as predictors. Regression analysis is one of the methods to find the trends in data. The independent variable used in Regression analysis is named Predictor variable. It offers data of an associated dependent variable regarding a particular outcome.
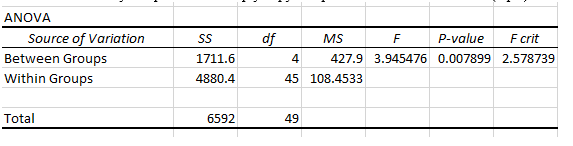
Detergent manufacturers frequently make claims about effectiveness of their product. A consumer-protection service decided to test the five best selling brands of detergent in three water temperatures on their claim of producing the “whitest whites”. One hundred and fifty white sheets were equally soiled. Thirty sheets were washed in each of the five brands; 10 in cold water, 10 in warm water and 10 in hot water. After washing, the “whiteness” was measured with laser equipment.
Perform the appropriate post-hoc analyses and clearly state your conclusions about the performance of the different brands in lukewarm water.
| Temperature | Dtrgent1 | Dtrgent2 | Dtrgent3 | Dtrgent4 | Dtrgent5 |
| Cold | 66 | 83 | 70 | 44 | 84 |
| Cold | 87 | 62 | 75 | 59 | 67 |
| Cold | 55 | 61 | 62 | 47 | 99 |
| Cold | 41 | 85 | 68 | 60 | 85 |
| Cold | 68 | 75 | 72 | 79 | 73 |
| Cold | 49 | 78 | 92 | 62 | 74 |
| Cold | 52 | 68 | 70 | 73 | 76 |
| Cold | 57 | 66 | 71 | 64 | 82 |
| Cold | 66 | 93 | 74 | 69 | 79 |
| Cold | 62 | 81 | 80 | 81 | 79 |
| Lukewarm | 78 | 63 | 71 | 70 | 87 |
| Lukewarm | 65 | 47 | 88 | 80 | 100 |
| Lukewarm | 68 | 88 | 90 | 78 | 83 |
| Lukewarm | 75 | 74 | 85 | 72 | 82 |
| Lukewarm | 57 | 71 | 78 | 71 | 93 |
| Lukewarm | 48 | 71 | 69 | 75 | 76 |
| Lukewarm | 84 | 71 | 60 | 101 | 87 |
| Lukewarm | 69 | 68 | 80 | 81 | 76 |
| Lukewarm | 55 | 80 | 61 | 87 | 70 |
| Lukewarm | 78 | 68 | 89 | 84 | 78 |
| Hot | 99 | 82 | 97 | 85 | 84 |
| Hot | 87 | 85 | 98 | 83 | 95 |
| Hot | 57 | 72 | 79 | 94 | 82 |
| Hot | 84 | 71 | 60 | 89 | 74 |
| Hot | 93 | 72 | 84 | 77 | 97 |
| Hot | 64 | 77 | 58 | 100 | 87 |
| Hot | 90 | 73 | 79 | 92 | 80 |
| Hot | 85 | 88 | 86 | 102 | 76 |
| Hot | 64 | 75 | 91 | 93 | 91 |
| Hot | 84 | 77 | 75 | 86 | 96 |

Step by step
Solved in 3 steps with 7 images


