Column 2: 142, 123, 171, 133, 165, 121, 108, 100, 95, 134, 148, 100, 106, 110, 111. Today, a personal trainer claims the mean weight has significantly gone down from last year. Last year, the mean weight from the population was 164.52 lbs. The trainer uses a random sample of 15 female adults after being on the diet for one year and determines their weight (column 2). Use a hypothesis test (t-test) to test the trainers’ claim using a 5% significance level.


Inverse Normal Distribution
The method used for finding the corresponding z-critical value in a normal distribution using the known probability is said to be an inverse normal distribution. The inverse normal distribution is a continuous probability distribution with a family of two parameters.
Mean, Median, Mode
It is a descriptive summary of a data set. It can be defined by using some of the measures. The central tendencies do not provide information regarding individual data from the dataset. However, they give a summary of the data set. The central tendency or measure of central tendency is a central or typical value for a probability distribution.
Z-Scores
A z-score is a unit of measurement used in statistics to describe the position of a raw score in terms of its distance from the mean, measured with reference to standard deviation from the mean. Z-scores are useful in statistics because they allow comparison between two scores that belong to different normal distributions.
Column 2: 142, 123, 171, 133, 165, 121, 108, 100, 95, 134, 148, 100, 106, 110, 111.
Today, a personal trainer claims the mean weight has significantly gone down from last year. Last year, the mean weight from the population was 164.52 lbs. The trainer uses a random sample of 15 female adults after being on the diet for one year and determines their weight (column 2). Use a hypothesis test (t-test) to test the trainers’ claim using a 5% significance level.
State the hypotheses.

That is, there is no evidence to conclude that mean weight has significantly gone down from last year

That is, there is evidence to conclude that mean weight has significantly gone down from last year
Obtain the value of the test statistic.
Use EXCEL Procedure to obtain values for the given samples.
Follow the instruction to obtain the value of mean and SD:
- Open EXCEL
- Go to Data>Data Analysis.
- Choose Descriptive Statistics.
- Enter the input range as $A$1:$A$16.
- Check the Labels in the first row.
- Check the option Summary statistics
- Click OK.
EXCEL output:
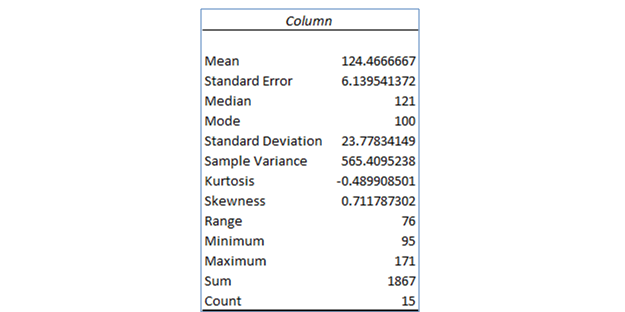
From the EXCEL output, the value of mean is 124.4667 and the standard deviation is 23.7783.
The required value is,
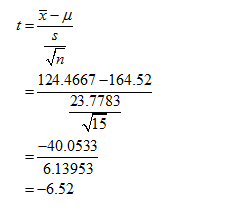
Thus, the value of the test statistic is –6.52.

Trending now
This is a popular solution!

Step by step
Solved in 3 steps with 6 images

What is the critical value from the t-table?


