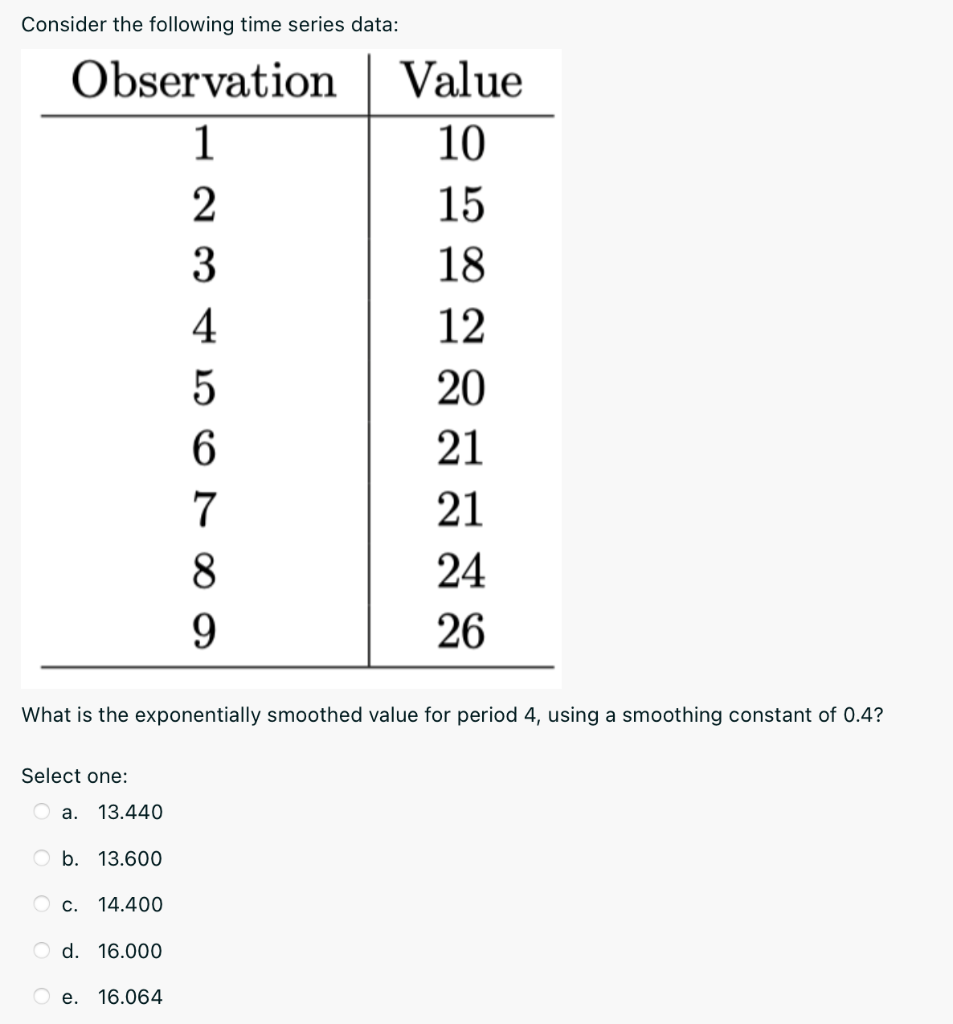
What is the exponentially smoothed value for period 4, using a smoothing constant of 0.4?


Q: studies have used the method of tree-ring dating in an effort to determine when prehistoric people…
A: Given that : μ = 1256 years ? = 37 years By using the empirical rule of normal distribution.
Q: There are 2 blue balls, 1 white ball and 3 red balls in an urn. 2 balls are drawn at random. Find…
A: It is given that Number of blue balls = 2 Number of white balls = 1 Number of red balls = 3 Total =…
Q: The data show the bug chirps per minute at different temperatures. Find the regression equation,…
A:
Q: The following is a probability distribution function for X, with range 0, 1, 2, P(X = 0) = 0.3 P(X =…
A: The probability distribution is given by X 0 1 2 3 P(x) 0.3 0.3 0.2 0.2
Q: Can you help me figure this out? 345 adults are surveyed, 145 said they have previously ownded…
A: Given
Q: A fair die is tossed once. If we are told that the number observed is at least four, what is the…
A:
Q: 60 students were surveyed about how many nights in a week they work on homework problems in their…
A: Given that
Q: Solve the problem. For a particular normal distribution, the mean is 80 and the standard deviation…
A:
Q: 1. Identifying the independent-measures design Which of the following experiments uses independent…
A: The objective is to identify the experiment that uses independent samples.
Q: One bag contains 4 white balls and 2 black balls; another contains 3 white balls and 5 black. If one…
A:
Q: Test the claim about the differences between two population variances o and o at the given level of…
A:
Q: Done 令@100% A learn.hawkeslearning.com Question 1 of 5, Step 2 of 3 1/15 Correct A psychology…
A:
Q: QUESTION 4 The time to failure of a typical household refrigerator has the following PDF Jo.000192t2…
A:
Q: speople working (x) 0.671 0.319 To test the hypotheses Ho:B1-0 versus HA: B1 *0, the P-value of the…
A:
Q: 1. Identifying related samples For each of the following research scenarios, decide whether the…
A: Given that
Q: The grades for 30 students on the most recent exam are given in the data table below: Round your…
A:
Q: 11. Find the probability of the indicated event if P(E) = 0.20 and P(F) = 0.35. Find P(E and F) if…
A: Obtain the probability of P(E and F). The probability of P(E and F) is obtained below as follows:…
Q: A test is made of #o4= 41 population standard deviation is =49, Compute the value of the test…
A: Given: n=67 x¯=45σ=29
Q: researcher wishes to estimate the proportion of the adult population of the U.S. has sleep…
A: E=0.03 99% confidence interval for z=2.576 p=0.5
Q: What is the P-value for the following scenario? A researcher claims that a post-lunch nap improves…
A:
Q: We have created a 95% confidence interval for μ with the result (148, 196). What conclusion will we…
A: We have created a 95% confidence interval for μ with the result (148, 196). What conclusion will we…
Q: random sample of 40 college students has mean annual earnings of $3,245 and a standard deviation of…
A: Given that ; n = 40 ? = $ 567 Sample mean = $ 3245 At 99% confidence interval By using the…
Q: A fitness course claims that it can improve an individual's physical ability. To test the effect of…
A:
Q: Residual Length Length, y Length, y 1.84 Time, x 1. The following data represent the time between…
A: For the given data Select the correct choice
Q: Test the hypothesis using the P-value approach. Be sure to verify the requirements of the test. Ho:…
A: Given that Sample size n =500 Favorable cases x =410 Sample proportion p^=x/n =410/500 =0.82…
Q: A machine makes sticks of butter whose average weight is 4.0 ounces. The SD of the weights is 0.05…
A:
Q: 00 ト d H_a: p < 0.15 Answered Resa Question 7 Suppose the p-value is 0.075 at a = 0.05. What is…
A:
Q: 60 students were surveyed about how many nights in a week they work on homework problems in their…
A: The value of mean number of days of homework is,
Q: The following data set are four replicas for the measurements of the concentration in Molarity of…
A: We have to calculate the mean, median standard deviation from the following data. Note: According…
Q: Ix(t). Prove that (0)
A: The moment generating function as, Mxt=EetxMxt=∑tetx.fx
Q: Find the equation of the regression line for the given data. Then construct a scatter plot of the…
A: Note: According to Bartleby expert guidelines, we can answer only first question with their three…
Q: Q2 A computer used by a 24-hour banking service is supposed to randomly assign each transaction to…
A:
Q: Provide a Descriptive interpretation based on the given data; use an APA format as much as possible.
A: Descriptive statistics is otherwise called summary statistics.
Q: (a) State the null hypothesis /, and the alternative hypothesis /H H, :0
A: We have given that Population mean = 45 Sample mean = 44 Population standard deviation = 7 Sample…
Q: value and the arithmetic mean. The deviation is always the absolute value of the difference between…
A: We have given that the data values, 17.33%, 17.34%, 17.28%, 17.29%, 17.36%
Q: nt criticaliy ón the following state- ments: (a) Road accidents resulted in 4513 deaths in 1958 and…
A:
Q: You are administering a survey through schools to assess attitudes toward adopting healthy behaviors…
A: Systematic sampling selects a random starting point from the population, and then a sample is taken…
Q: A national study report indicated that 20.9% of Americans were identified as having medical bill…
A: For the given data Find Critical value =?
Q: 1. You are tasked with figuring out the number of players your servers will need to handle during a…
A:
Q: Listed below are the lead concentrations (in μg/g) measured in different Ayurveda medicines.…
A: From the provided information, Sample size (n) = 10 Level of significance (α) = 0.05
Q: Use the theoretical method to determine the probability of the following event. Sharing a birthday…
A: Given: To find the probability of a birthday in July
Q: Given the set of numbers: {1, 4, 3, -4}, find their variance and standard deviation. [Hint: For…
A:
Q: Hi, Can you help me with this question? A survey of 600 non fatal accidents show that 261 involved…
A: We have given that, Favorable cases (X) = 261 and sample size (n) = 600 Then, We will find the…
Q: 6. Let the sample space be S ={1, 2, 3, 4, 5, 6, 7, 8, 9, 10}. Suppose the outcomes are equally…
A: We have given that The sample space is S = { 1, 2, 3, 4, 5, 6, 7, 8, 9, 10 }. The outcomes are…
Q: The owner of a chain of mini-markets wants to compare the sales performance of two of her stores,…
A: For the given data Perform paired t test
Q: A manufacturer of metal plates makes two claims concerning the thickness of the plates they produce.…
A: From the given data in part (b), we calculate sample mean and sample variance Mean,…
Q: The table available below shows the weights (in pounds) for a sample of vacuum cleaners. The weights…
A: For the given data Perform Anova: Single Factor
Q: Question 12 You wish to estimate the average weight of frogs in a certain pond. You plan to randomly…
A: We have given that, Margin of error (E) = 0.25, population standard deviation (σ) = 1.3 and…
Q: Determine the t critical value for a two-sided confidence interval in each of the following…
A:
Q: A well-known brokerage firm executive claimed that 50% of investors are currently confident of…
A: Consider that p is the true proportion of people who are confident.


Trending now
This is a popular solution!

Step by step
Solved in 2 steps

- Table 6 shows the population, in thousands, of harbor seals in the Wadden Sea over the years 1997 to 2012. a. Let x represent time in years starting with x=0 for the year 1997. Let y represent the number of seals in thousands. Use logistic regression to fit a model to these data. b. Use the model to predict the seal population for the year 2020. c. To the nearest whole number, what is the limiting value of this model?consider the following time series data.Month 1 2 3 4 5 6 7Value 24 13 20 12 19 23 15a. compute MSe using the most recent value as the forecast for the next period. Whatis the forecast for month 8?b. compute MSe using the average of all the data available as the forecast for the nextperiod. What is the forecast for month 8?c. Which method appears to provide the better forecast?Which of the following time series forecasting methods would not be used to forecast seasonal data?
- Develop seasonal factors from the table below by following a 3-MA values for the time series data t 1 2 3 4 5 6 7 8 9 y 13 18 13 14 13 16 14 21 13Consider the following time series data. Week 1 2 3 4 5 6 Value 18 13 16 11 17 14 Construct a time series plot. What type of pattern exist in the data? Develop a three-week moving average for this time series. Compute MSE and forecast for week 7. Use a = 0.2 to compute the exponential smoothing values for the time series. Compute MSE and forecast for week 7.The following plots have been obtained for a time series. a) Suggest an appropriate ARIMA model. b) The following ARIMA output has been obtained from R. Based on this output, which model would you recommend for forecasting?
- Consider the following time series data. a. Show the four-quarter and centered moving average values for this time series (to 3 decimals if necessary). b. Compute seasonal indexes and adjusted seasonal indexes for the four quarters (to 3 decimals).1. Consider the following time series: a. Construct a time series plot. What type of pattern exists in the data? b. Use simple linear regression analysis to find the parameters for the line that minimizes MSE for this time series.Consider the following time series data Month 1 2 3 4 5 6 7 8 9 10 11 12 Value 90 89 86 91 90 91 88 86 91 93 90 88 a) Construct a time series plot in Excel. Label the axes and graph. c) Develop a smoothing model forecast with α = 0.35. Compute MSE and forecast for month 13 d) Which model is the better predictor? Why?
- Consider the following time series data: 1 2 3 4 5 6 7 26 15 22 14 21 25 17 PART 1.Compute MSE using the most recent value as the forecast for the next period and then calculate the forecast for month 8. PART 2.Compute MSE using the average of all the data available as the forecast for the next period. What is the forecast for month 8?consider the following time series data.t 1 2 3 4 5 6 7yt10 9 7 8 6 4 4a. construct a time series plot. What type of pattern exists in the data?b. develop the linear trend equation for this time series.c. What is the forecast for t = 8?Below you are given the first five values of a quarterly time series. The multiplicative model is appropriate and a four-quarter moving average will be used. Year Quarter Time Series Value Yt 1 1 36 2 24 3 16 2 4 20 1 44 An estimate of the combined trend-cycle component (T2Ct) for Quarter 3 of Year 1 (used for estimating the de-trended values), when a four-quarter moving average is used, is a. 24. b. 26. c. 28. d. 25.
