In the previous problem, we explored the idea that a confidence interval can be expressed in two ways. Suppose we surveyed a sample of Oregonians and found that 52% of them preferred Coke over Pepsi, with a margin of error of 4%. To estimate the population proportion (p) of all Oregonians who prefer Coke, we could say p is 52% + 4%, or pis between 48% and 56%, or even 48% < p < 56% Let's practice this idea: Express the confidence interval 12.7 % ± 4.3 % in the form of an inequality. Fill in blanks with percentages rounded to one place after the decimal. %
In the previous problem, we explored the idea that a confidence interval can be expressed in two ways. Suppose we surveyed a sample of Oregonians and found that 52% of them preferred Coke over Pepsi, with a margin of error of 4%. To estimate the population proportion (p) of all Oregonians who prefer Coke, we could say p is 52% + 4%, or pis between 48% and 56%, or even 48% < p < 56% Let's practice this idea: Express the confidence interval 12.7 % ± 4.3 % in the form of an inequality. Fill in blanks with percentages rounded to one place after the decimal. %

MATLAB: An Introduction with Applications
6th Edition
ISBN:9781119256830
Author:Amos Gilat
Publisher:Amos Gilat
Chapter1: Starting With Matlab
Section: Chapter Questions
Problem 1P

Related questions
Question
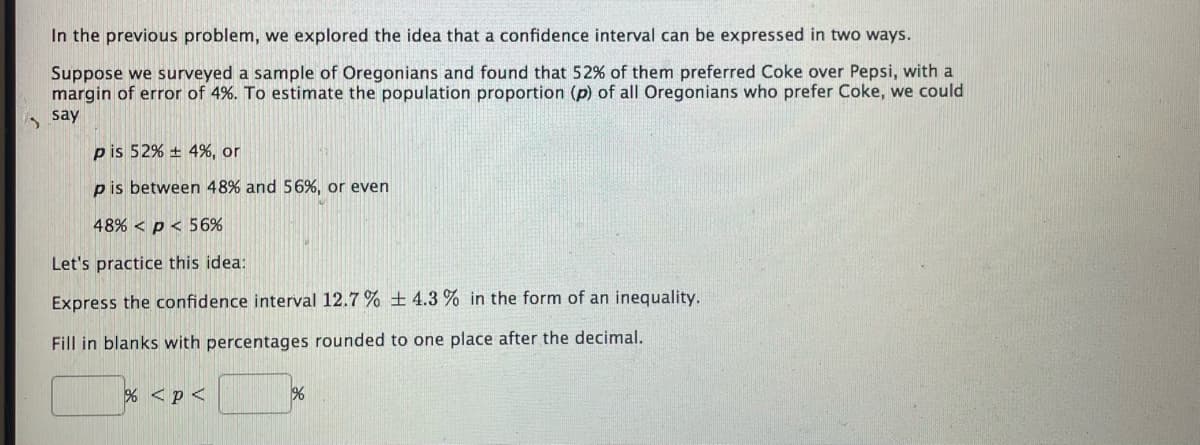
Transcribed Image Text:In the previous problem, we explored the idea that a confidence interval can be expressed in two ways.
Suppose we surveyed a sample of Oregonians and found that 52% of them preferred Coke over Pepsi, with a
margin of error of 4%. To estimate the population proportion (p) of all Oregonians who prefer Coke, we could
, say
pis 52% + 4%, or
p is between 48% and 56%, or even
48% < p < 56%
Let's practice this idea:
Express the confidence interval 12.7 % ± 4.3 % in the form of an inequality.
Fill in blanks with percentages rounded to one place after the decimal.
% <p<
Expert Solution
This question has been solved!
Explore an expertly crafted, step-by-step solution for a thorough understanding of key concepts.

This is a popular solution!

Trending now
This is a popular solution!

Step by step
Solved in 2 steps

Recommended textbooks for you
MATLAB: An Introduction with Applications
Statistics
ISBN:
9781119256830
Author:
Amos Gilat
Publisher:
John Wiley & Sons Inc

Probability and Statistics for Engineering and th…
Statistics
ISBN:
9781305251809
Author:
Jay L. Devore
Publisher:
Cengage Learning

Statistics for The Behavioral Sciences (MindTap C…
Statistics
ISBN:
9781305504912
Author:
Frederick J Gravetter, Larry B. Wallnau
Publisher:
Cengage Learning
MATLAB: An Introduction with Applications
Statistics
ISBN:
9781119256830
Author:
Amos Gilat
Publisher:
John Wiley & Sons Inc
Probability and Statistics for Engineering and th…
Statistics
ISBN:
9781305251809
Author:
Jay L. Devore
Publisher:
Cengage Learning
Statistics for The Behavioral Sciences (MindTap C…
Statistics
ISBN:
9781305504912
Author:
Frederick J Gravetter, Larry B. Wallnau
Publisher:
Cengage Learning

Elementary Statistics: Picturing the World (7th E…
Statistics
ISBN:
9780134683416
Author:
Ron Larson, Betsy Farber
Publisher:
PEARSON

The Basic Practice of Statistics
Statistics
ISBN:
9781319042578
Author:
David S. Moore, William I. Notz, Michael A. Fligner
Publisher:
W. H. Freeman

Introduction to the Practice of Statistics
Statistics
ISBN:
9781319013387
Author:
David S. Moore, George P. McCabe, Bruce A. Craig
Publisher:
W. H. Freeman