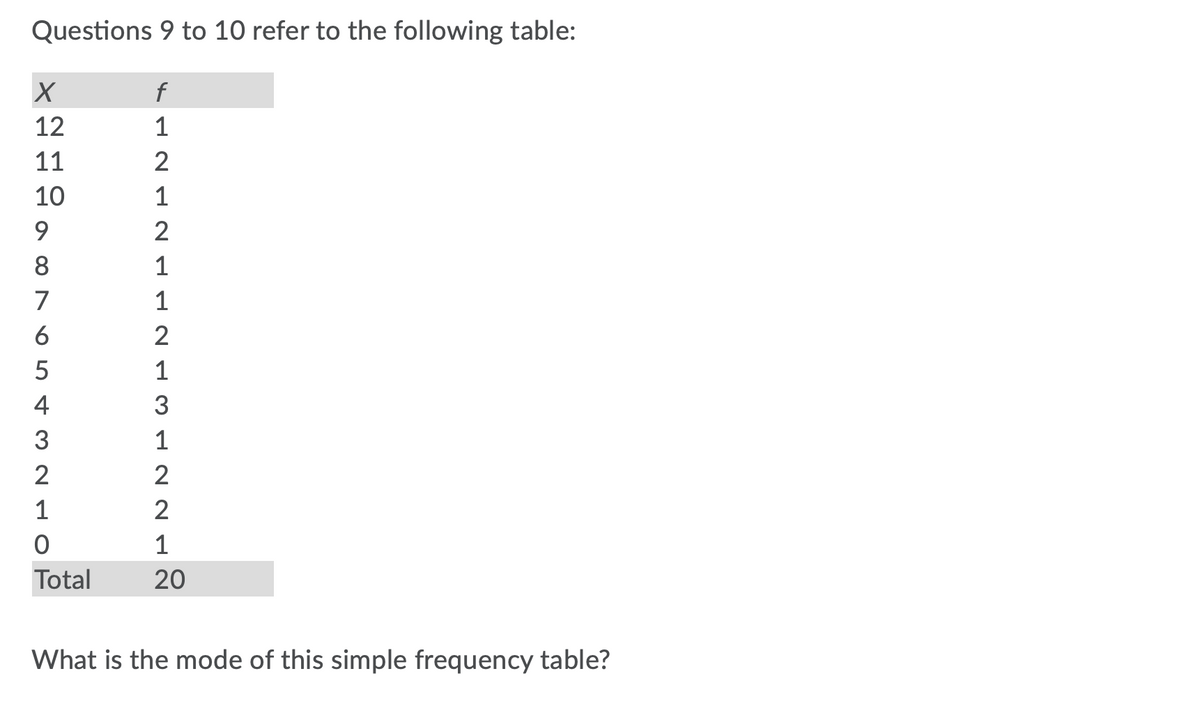
What is the mode of this simple frequency table?


Q: Calculate missing frequencies.
A:
Q: The following data set indicates the favourite brand of washing powder chosen by a sample of twenty…
A: In the given scenario, data was collected for the preference of washing powder brands in the Port…
Q: A biologist exposed a certain type of bacteria to gamma radiation to see how long they would live.…
A: Given histogram is
Q: Consider a frequency table that has 5 classes. The boundaries for class 1 are 0.9005 and 19.2545.…
A: Solution
Q: How did you find the frequency and relative frequency of this? Kindly show the formula or solution…
A: Given Information: A coin is tossed 10 times and the number of heads on each toss is recorded. The…
Q: A professor records the following final grades in one course. Construct a frequency table for the…
A:
Q: A data set with whole numbers has a low value of 10 and a high value of 120. Find the class width…
A: A data set consist of whole numbers Low value = 10 High value = 120 No. of classes(n)= 5
Q: The table below shows a frequency distribution of the lifetimes of electronic tubes produced at a…
A: Given,
Q: Complete the two-way frequency table. Kittens Female Male Total Solid color 1 Spotted 3 Total 10
A: Complete the following
Q: Write down the step-by-step transformation of a histogram into a frequency Polygon.
A: Frequency polygon: Frequency polygon is a graph that is used to summarize the grouped data which is…
Q: a. Fill in the two-way frequency table below: Right Handed Left Handed Totals Males Females Totals
A: There are 50 people out of which 22 are right-handed males,19 are right-handed females,5 are…
Q: Is the following a relative frequency polygon? Explain Details
A: Solution : Given that, By observing the relative frequency polygon X is a continuous random…
Q: "From the following data find out the missing frequencies : (AB) = 100 , (A) = 300 , (N) = 1,000 ,…
A:
Q: Do the following: d) Construct a frequency histogram. e) Construct an ogive.
A: Form the given data we have the frequency distribution as below: We plot the frequency histogram…
Q: what do you understand by frequency polygon?
A: A Frequency polygon is a graph constructed by using lines to join the midpoints of each interval, or…
Q: Which is the best description of a two-way frequency table? A table that represents all the…
A: Answer: A table that represents all the relationships among two different categories of data.
Q: how can i mmake a frequency table?
A: A frequency table has to be made.
Q: Section 2.1 1. Automobile fatalities The table gives the numbers of passenger car occupants killed…
A: The table gives the number of passenger car occupants killed in accidents in 2011 by car type The…
Q: The table to the right gives the number of passenger car occupants killed in accidents in a certain…
A: The number of values corresponding to a class or observation is defined as the frequency of that…
Q: Every year, the students at a school are given a musical aptitude test that rates them from 0 (no…
A: Average: Given information: x f x*f 0 1 0 1 3 3 2 5 10 3 0 0 4 4 16 5 3 15 44…
Q: What's the equation to find the frequency in excel sheets?
A: Frequency function can be used to find frequencies in Excel sheets. The frequency function…
Q: From the following data find out the missing frequencies : (AB) = 100 (A)= 300 (N)=1000 (B)= 600
A: Given (AB)=100, (A)=300, (N)=1000, (B)=600
Q: Su The table to the right gives the number of passenger car occupants killed in accidents in a…
A: The data is given by Car type frequency Subcompact 1300 Compact 4169 Intermediate 4026…
Q: what is a frequency rate formula
A: we know that Frequency rate measures the frequency of accident occurrence .
Q: A data set with whole numbers has a low value of 20 and a high value of 89.Find the class width for…
A:
Q: Draw a frequency polygon based on the data.
A:
Q: The 98.6 degree standard for human body temperature was derived by a German doctor in 1868. In an…
A: a)From the histogram shown in the question, the shape of the distribution is approximately…
Q: Use JMP to create a barplot from the following Frequency Table 5 7 9 11 13 15 17 19 4 6 13 10 75 3 2
A: Note: Hi there! Thank you for posting the question. As you have posted multiple questions, as per…
Q: Lines at the Department of Motor Vehicles are so long! A supervisor decided to conduct a study on…
A: Mode: In statistics, the mode is the value which is repeatedly occurring in a given set. We can…
Q: What is Frequency Polygon?
A:
Q: In Mr. Smith's 20 person English literature class, the students earned the föllowing grades:…
A: make table and count individual number of grades
Q: Here is some data from a previous class of students, where I asked them their favorite pet: Dog Fish…
A: 1. Frequency Percentage Dog 11 27% Cat 10 24% Lizard 1 2% Horse 1 2% Pig 1 2%…
Q: A class of 30 students was asked how many brothers and sisters they have. Here are the results. 2 4…
A: We want to make tally marks and frequency table and make interpretation
Q: Is this an FM or a PM signal? Explain.
A:
Q: The above chart is an example of:
A: Given,
Q: For the grouped frequency table shown below which shows salaries at a company (expressed in…
A: It is given that Interval for second row in the table = 30 - 40
Q: What is the relative frequency for the interval covered by the leftmost bar? Give your answer to 3…
A: The count (frequency) for leftmost bar is 8. The Total count (total frequency) is 8+4+1+6+12+9+12+12…
Q: what is a frequency rate?
A: The frequency rate is the number of people injured in a year per one million man-hours worked.
Q: Find Range in the following frequency distribution:
A: Here Range= maximum value- minimum value
Q: The mean of the frequency distribution is degrees. (Round to the nearest tenth as needed)
A:
Q: making the frequency table and finding the ages of the most common winners
A: First we arrange the data in ascending order so it would be easy to count frequencies for every…
Q: A drink vendor randomly asked college students how many soft drinks they had consumed during the…
A: The frequency table is No of soft drinks Frequency 0 3 1 5 2 1 3 2 4 2 5 1 6 0 7…
Q: Construct a frequency table for this data set as well as a pie chart using excel and XLSTA
A: Pie chart : A chart could be a spherical applied math visual that's divided into slices to indicate…
Q: CORStruct a frequency distribution for the g class has the greatest frequency and whic
A: Frequency Distribution is constructed below: From the given information, the maximum value is…
Q: Using the information provided in the image draw a cumulative frequency polygon
A: Given the midday temperature in the month of march: Groups of temperature Frequency 22-24 8…
Q: how do I go about constructing a frequency distrubution with a lower class of 15.0 and a classwidth…
A: The provided information is the lower class limit and the class width which is 15.0 and 6…
Q: Can you walk me through creating a frequency table and a histogram for this data in excel please?
A: The data shows the ages of all Academy Award-winning make actors at the time when they won the…
Q: 1. What information should be present in a frequency table and why?
A: Answer: Frequency refers to the number of times an event or a value occurs. A frequency table is a…

Step by step
Solved in 2 steps


- 1. Create the frequency table of the data.Question # 5 The ages of the 10 best actresses in Hollywood are as follows: 32, 48, 51, 63, 57, 60, 52, 54, 48, 71. Use the 10 ages of the best actresses to calculate the interquartile range.Consider the following frequency table obtained by rolling a six-sided die 87 times. Result Frequency Relative Frequency Cumulative Frequency 1 20 * * 2 * 0.126 * 3 * * 50 4 11 * * 5 * 0.08 * 6 * * * Fill in the frequency table. Provide the number of rolls that resulted in a 6
- Draw two bar graphs for these data, the first without truncating the frequency axis, and the second by truncating this axis. In the second graph, mark the number of girls on the vertical axis starting with 13.0. Briefly comment on the two bar. please answer step by step. Must draw graph follow question.Answer must be corrsectQuestion 1: using 10 classes construct a frequency distribution.We have a sample of 103 observations, which range in value from 25 to 67. Which of the following proposals would allow us to obtain a frequency data for the data? a) 5 classes of width 8 with maximum value 70 b) 5 classes of width 8 with maximum value 67 c) 6 classes of width 7, with minimum value 25 d) 6 classes of width 7, with minimum value 20
- Anyone know frequency tables or to understand themLook at the relative frequency table above. What is P(X = 3)?The following data gives the monthly electric bills ( in pesos) of 25 residents in Lapu-Lapu City. Make a frequency table: 1364 1234 2310 1364 1724 1234 1468 1567 1468 1364 2980 1364 1567 2980 1364 1468 2879 2310
- Respond to all of the following questions (1-10) using the table to determine your answer. (Exhibit 1.1) Please be sure to type directly onto this document or to copy and paste the question and your response onto another document.Exhibit 1.118 13 10 16 1413 17 15 13 1114 14 11 10 1212 11 13 15 912 13 16 8 15 1. Complete the chart below to create a frequency distribution from the set of scores using Exhibit 1.1The inner diameters of washers produced by a company can be measured to the nearest thousandth of an inch. If the class marks of a frequency distribution of these diameters are given in inches by 0.587,0.602 0.617, 0.632, and 0.647, the class size is Blank 1Use the relative frequency table shown to the right to calculate the number of the 400 measurements falling into each of the measurement classes. Then graph a frequency histogram for these data.