What is the sensitivity of this test? What is the specificity of this test?

MATLAB: An Introduction with Applications
6th Edition
ISBN:9781119256830
Author:Amos Gilat
Publisher:Amos Gilat
Chapter1: Starting With Matlab
Section: Chapter Questions
Problem 1P

Related questions
Question
What is the sensitivity of this test? What is the specificity of this test?
Transcribed Image Text:CHECK YOUR UNDERSTANDING
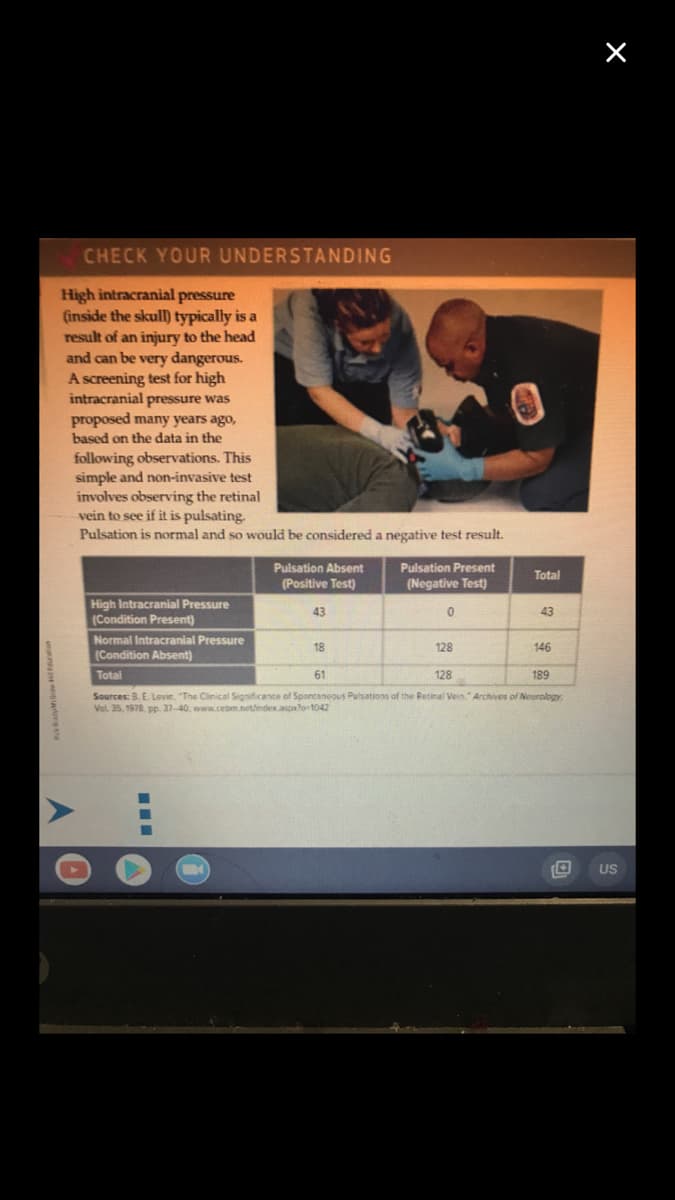
High intracranial pressure
(inside the skull) typically is a
result of an injury to the head
and can be very dangerous.
A screening test for high
intracranial pressure was
proposed many years ago,
based on the data in the
following observations. This
simple and non-invasive test
involves observing the retinal
vein to see if it is pulsating.
Pulsation is normal and so would be considered a negative test result.
Pulsation Absent
(Positive Test)
Pulsation Present
Total
(Negative Test)
High Intracranial Pressure
(Condition Present)
43
43
Normal Intracranial Pressure
18
128
146
(Condition Absent)
Total
61
128
189
Sources: B. E. Levin, "The Clinical Significante of Spontaneous Pulsations of the Retinal Vein." Archives of Neurology
Vol. 35, 1978. pp. 37-40, www.cebm.netindex aspalor1042
US
Expert Solution
This question has been solved!
Explore an expertly crafted, step-by-step solution for a thorough understanding of key concepts.

Step by step
Solved in 2 steps

Recommended textbooks for you
MATLAB: An Introduction with Applications
Statistics
ISBN:
9781119256830
Author:
Amos Gilat
Publisher:
John Wiley & Sons Inc

Probability and Statistics for Engineering and th…
Statistics
ISBN:
9781305251809
Author:
Jay L. Devore
Publisher:
Cengage Learning

Statistics for The Behavioral Sciences (MindTap C…
Statistics
ISBN:
9781305504912
Author:
Frederick J Gravetter, Larry B. Wallnau
Publisher:
Cengage Learning
MATLAB: An Introduction with Applications
Statistics
ISBN:
9781119256830
Author:
Amos Gilat
Publisher:
John Wiley & Sons Inc
Probability and Statistics for Engineering and th…
Statistics
ISBN:
9781305251809
Author:
Jay L. Devore
Publisher:
Cengage Learning
Statistics for The Behavioral Sciences (MindTap C…
Statistics
ISBN:
9781305504912
Author:
Frederick J Gravetter, Larry B. Wallnau
Publisher:
Cengage Learning

Elementary Statistics: Picturing the World (7th E…
Statistics
ISBN:
9780134683416
Author:
Ron Larson, Betsy Farber
Publisher:
PEARSON

The Basic Practice of Statistics
Statistics
ISBN:
9781319042578
Author:
David S. Moore, William I. Notz, Michael A. Fligner
Publisher:
W. H. Freeman

Introduction to the Practice of Statistics
Statistics
ISBN:
9781319013387
Author:
David S. Moore, George P. McCabe, Bruce A. Craig
Publisher:
W. H. Freeman