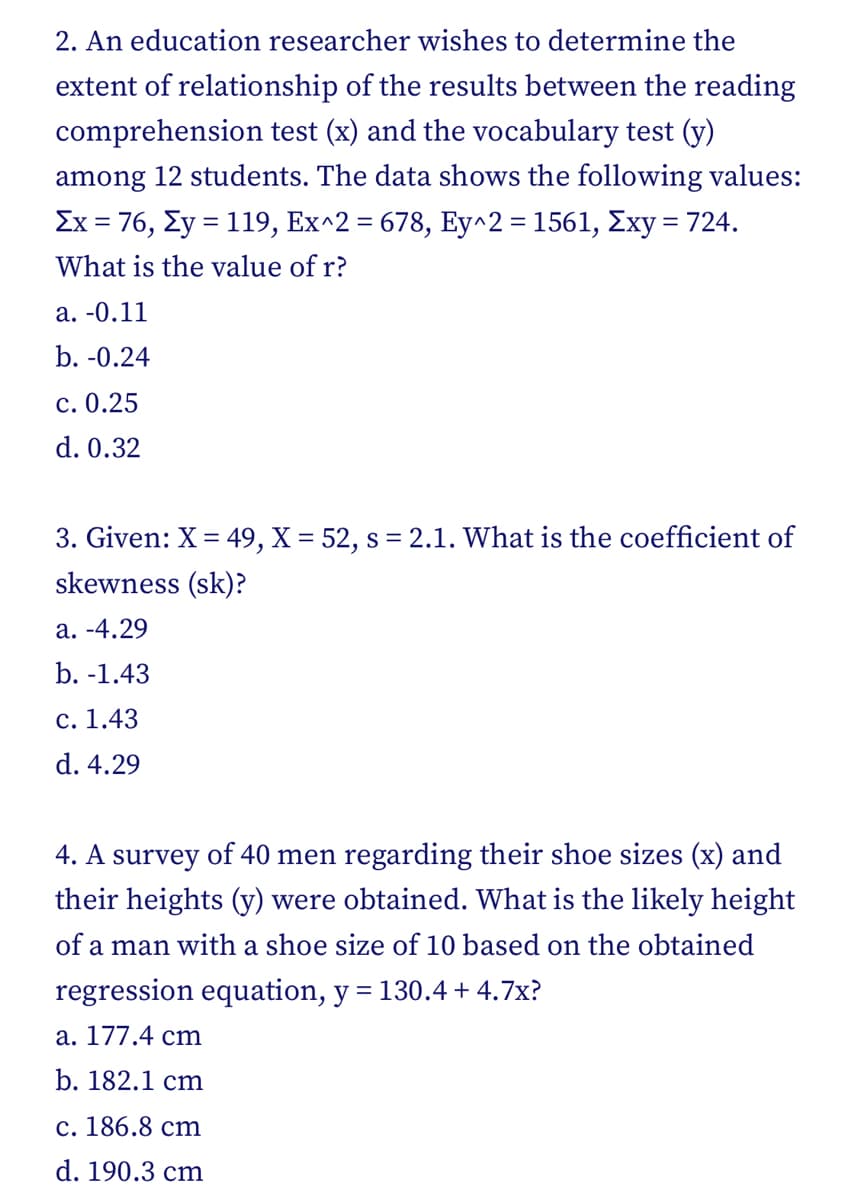
What is the value of r? a. -0.11 b. -0.24 c. 0.25 d. 0.32


Q: 1. The average grade of the whole class under study is 82.15. Whole class: Average grade (82.15):
A: Note: Thank you for the question. Since multiple questions are posted, we are answering the first…
Q: A smart phone manufacturer wants to find out what proportion of its customers are dissatisfied with…
A: Given that - A smart phone manufacturer wants to find out what proportion of its customers are…
Q: At a certain plant, batteries are produced with a life span that is normally distributed with a…
A:
Q: The probability that a person in the United States has type B* blood is 10%. Three unrelated people…
A:
Q: Scenario: A mathematics placement test is given to all entering freshmen at a small college. A…
A: The question is based on a correlation Given :
Q: The data represent the time, in minutes, spent reading a political blog in a day. Construct a…
A:
Q: Below shows the advertising costs and corresponding sales of JBC Holdings for 10 years Advertising…
A: Given : Advertising Costs(In Million Pesos) Sales(In Million Pesos) 7.4 30 7.5 25 8.5 31.5…
Q: In a recent court case it was found that during a period of 11 years 872 people were selected for…
A: Given n=872 P=0.809
Q: The following function is cumulative distribution function. 0 x < -15 0.30 -15 < x < 45 F(x) = 0.90…
A:
Q: A researcher computes the correlation coefficient r =r= 0.6939 for an explanatory and response…
A: Given : Correlation coefficient = r = 0.6939
Q: The actual tracking weight of a stereo cartridge that is set to track at 3 g on a particular changer…
A: For the given data Find all the required
Q: The following are the scores of Grade 10 students in Mathematics test. 1. Construct a grouped…
A: The objective is to construct a frequency distribution for the given data:
Q: The data represent the time, in minutes, spent reading a political blog in a day. Construct a…
A: Given : 46 39 48 34 16 49 31 28 13 24 15 11 34 46 40 4 45 21 0 30
Q: Petroleum pollution in oceans stimulates the growth of certain bacteria. An assessment of this…
A:
Q: Refer to the accompanying table, which describes results from groups of 8 births from 8 different…
A:
Q: Diagram below shows the normality test for impact of covid-19 pandemic on unemployment rate in…
A: Jarque Bera is a measure that used to determine the normality exist in the data set or not. It…
Q: 22. Given a random sample {(x₁.y₁), (x₂.32)., (xn. Yn)} such that Sxx = 107 and Syy = 54.75. If the…
A:
Q: . When you performed null hypothesis tests using a z-test for one sample proportion, what kinds of…
A: Given p=population proportion=0.16 Hypothesis Ho: p=0.16(claim) vs H1: p≠0.16 Reject the null…
Q: A Data analytics professor wants to know whether level of college education influences the grade…
A: In generally we know to test the "test of independence" we use Chi-Square test. Here we also do the…
Q: PROBLEM 1 In a study of the relationship between the oxygen content (parts per thousand) and the…
A: Note: As per guidelines we are supposed to solve only first three sub parts. Please repost the other…
Q: Use the frequency distribution shown below to construct an expanded frequency distribution. High…
A:
Q: 3. A random sample of 130 human body temperatures had a mean of 98.25 degrees and a standard…
A: For the given data Perform t test for one mean
Q: Scenario: A mathematics placement test is given to all entering freshmen at a small college. A…
A: The regression equation is given by y' = a + bX
Q: Compute the t- value for each: 1. Find the t- value when μ = 42, , x = 43, s = 5 and n = 20 2. Find…
A:
Q: Q3 Test the given claim. Identify the null hypothesis, alternative hypothesis, test…
A: For the given data Perform Z test for two proportions
Q: In a butter-packing plant, the quantity of butter packed in a day using a certain type of machine is…
A: Given data: 9.5, 9.5, 11.2, 10.6, 9.9, 11.1, 10.9, 9.8, 10.1, 10.2, 10.9, 11.0 Sample size n=12…
Q: Teacher Rowelin wants to estimate the average time of her students spend in TikTok and wants to…
A: Given that n =25 ,alpha = 0.01 ,mean =6,s.d =2
Q: Sample 3 3.5 4 4.5 5 6 mean Probability 1/16 2/16 3/16 2/16 1/16 Find the standard error of the…
A: Introduction: It is required to calculate the standard error of the sample mean using the given…
Q: B. Determine which measure of central tendency is appropriate to use in making the following…
A: B. 4. Daily Meal allowance of learners in a school to be used by the canteen manager to plan for a…
Q: Scenario: A mathematics placement test is given to all entering freshmen at a small college. A…
A: Correlation coefficient is denoted by r
Q: How many three numbers with no repeated digits, can be formed by the use of the digits 0, 2, 3, 4,…
A: here AS PER GUIDELINES I HAVE CALCULATED 3 SUBPARTS Three digit number is formed using digit…
Q: Q9. Let X and Y have the joint pdf f(x,y) = 2, 0≤x≤ y ≤ 1. Which of the following is true? (A) The…
A: Let X and Y be two continuous random variables defined over the sample space S. Then the continuous…
Q: Recall the scenario: The mean age for all Foothill College students for the last few years is 33.2.…
A: Sample size and level of confidence affect the error bound.
Q: b) Calculate the correlation coefficient. (2 decimal places) X (Age - years) Y (Annual xy Income -…
A: The provided information is b. x y xy x2 y2 33 33 1089 1089 1089 25 31 775 625 961 19 18…
Q: Kayden takes a simple random sample of 24 professional hockey players and 16 professional baseball…
A: Given datan1=24 n2=16μ1=197.57 μ2=208.63s1=16.58 s2=18.62
Q: Q13. Suppose that a certain type of electronic component follows an exponential distribution with a…
A:
Q: Multiple regression analysis was used to study how an individual's income (Y in thousands of…
A: Since we only do up to three sub parts of a problem, we'll be doing the first three sub parts only.…
Q: Using the steps in hypothesis testing determine if theres a significant relationshi between the size…
A: The question is about correlation Given data is :
Q: Determine the probability distribution's missing value. The probability that a tutor will see 0, 1,…
A:
Q: Determine z for the following of a. (Round your answers to two decimal places.) USE SALT (a) a =…
A: Given that i want to critical value for two tailed test.
Q: The error involved in making a certain measurement is a continuous rv X with the following cdf. 0…
A:
Q: Estimate the correlation coefficient for the data plotted below. 45 40 35 30 25 20 15 10 5 0 0 10…
A: Given image is example of strong positive correlation.
Q: Q8. In the casino game roulette, the probability of winning with a bet on red is 0.5. Let X be the…
A:
Q: Calculation of DMFT \ DMFS: 1- For individual 2- For population DMF = D + M + F Mean DMF = Total DMF…
A: calculation of DMFT \ DMFS
Q: Use the frequency histogram to complete the following parts. (a) Determine the number of classes.…
A: ( a ) ? Classes ( b ) Greatest frequency is about ? Least frequency is about ? ( c ) Class width =…
Q: Scenario: A mathematics placement test is given to all entering freshmen at a small college. A…
A: The objective is to plot a scatterplot and find the correlation coefficient for the following data:…
Q: 10. The most common species of sweat bees are green, red, and yellow. For each color, we select a…
A: Introduction: It is required to identify the correct labels for the histograms.
Q: Table below shows the monthly Sales of JBC Company for the year 2021 Month Sales(In Million…
A: The question is about time series analysis Given :
Q: Select the correct choice below and, if necessary, fill in the answer box to complete your choice. O…
A: It is given that Sample mean = 30.2 Sample standard deviation = 7.8 Sample size = 262
Q: a. What is the appropriate degrees of freedom? [Select ] b. What is the 90% confidence interval for…
A: here given , n = sample size = 8 sample mean = x = 37.8 C sample standard deviation = s = 1 C

Step by step
Solved in 2 steps

- Suppose a researcher is interested in the relationship between periodontal disease and a number of negative health outcomes. One outcome of particular interest to the researcher is hypertension (assume defined as systolic blood pressure above 140 mmHG). Suppose a team gathers a SRS of 348 participants with periodontal disease, and finds the sample average systolic blood pressure to be 157 mmHG. A) Using an assumed σ=16 mmHG, conduct a 1 sample Z test to determine if there is a relationship between periodontal disease and hypertension in this population. (Use α=0.05)The control department of a light bulb manufacturer randomly picks 4400 light bulbs from the production lot every week. The records show that, when there is no malfunction, the defect rate in the manufacturing process (due to imperfections in the material used) is 1%. When 1.25% or more of the light bulbs in the sample of are defective, the control unit calls repair technicians for service.(a) Find the mean of p, where is the proportion of defective light bulbs in a sample of 4400 when there is no malfunction. (b) Find the standard deviation of p. (c) Compute an approximation for P(p greater than/equal to 0.0125), which is the probability that the service technicians will be called even though the system is functioning properly. Round your answer to four decimal places.The control department of a light bulb manufacturer randomly picks 4400 light bulbs from the production lot every week. The records show that, when there is no malfunction, the defect rate in the manufacturing process (due to imperfections in the material used) is 1% . When 1.25% or more of the light bulbs in the sample of 4400 are defective, the control unit calls repair technicians for service. Answer the following. (If necessary, consult a list of formulas.) (a)Find the mean of p, where pis the proportion of defective light bulbs in a sample of 4400when there is no malfunction. (b)Find the standard deviation of p . (c)Compute an approximation for P≥p0.0125 , which is the probability that the service technicians will be called even though the system is functioning properly. Round your answer to four decimal places.
- The control department of a light bulb manufacturer randomly picks 4400 light bulbs from the production lot every week. The records show that, when there is no malfunction, the defect rate in the manufacturing process (due to imperfections in the material used) is 1%. When 1.25% or more of the light bulbs in the sample of 4400 are defective, the control unit calls repair technicians for service. Answer the following. (If necessary, consult a list of formulas.) (a)Find the mean of p, where p is the proportion of defective light bulbs in a sample of 4400 when there is no malfunction. (b)Find the standard deviation of p. (c)Compute an approximation for P≥p0.0125, which is the probability that the service technicians will be called even though the system is functioning properly. Round your answer to four decimal places.The control department of a light bulb manufacturer randomly picks 4400 light bulbs from the production lot every week. The records show that, when there is no malfunction, the defect rate in the manufacturing process (due to imperfections in the material used) is 1% . When 1.25% or more of the light bulbs in the sample of 4400 are defective, the control unit calls repair technicians for service. Find the mean of p , where p is the proportion of defective light bulbs in a sample of 4400 when there is no malfunction. Find the standard deviation of p . Compute an approximation for P≥p0.0125 , which is the probability that the service technicians will be called even though the system is functioning properly. Round your answer to four decimal places.) A study was conducted of the effects of a special class designed to aid students with verbal skills. Each child was given a verbal skills test twice, both before and after completing a 4-week period in the class. Let Y = score on exam at time 2 - score on exam at time 1. Hence, if the population mean µ for Y is equal to 0, the class has no effect, on the average. For the four children in the study, the observed values of Y are 8-5=3, 10-3=7, 5-2=3, and 7-4=3 (e.g. for the first child, the scores were 5 on exam 1 and 8 on exam 2, so Y = 8-5=3). It is planned to test the null hypothesis of no effect against the alternative hypothesis that the effect is positive, based on the following results from a computer software package: Variable Number of Cases Mean Std. Dev. Std. Error Y 4 4.000 2.000 1.000 Set up the null and alternative hypotheses.
- A physician wants to test if temperature has an effect on heart rate. In order to do this, she compares the heart rate in beats per minute of several random volunteers after a period of time in a room with a temperature of 50∘F and after a period of time in a room with a temperature of 75∘F. Suppose that data were collected for a random sample of 11 volunteers, where each difference is calculated by subtracting the heart rate in beats per minute in the 50∘F room from the heart rate in beats per minute in the 75∘F room. Assume that the populations are normally distributed. The test statistic is t≈5.627, α=0.05, the corresponding rejection regions are t<−2.228 and t>2.228, the null hypothesis is H0:μd=0, and the alternative hypothesis is Ha:μd≠0. Which of the following statements are accurate for this hypothesis test in order to evaluate the claim that the true mean difference between the heart rate in the 75∘F room and the heart rate in the 50∘F room is significantly not equal to…A physician wants to test if temperature has an effect on heart rate. In order to do this, she compares the heart rates in beats per minute of several random volunteers after a period of time in a room with a temperature of 50∘F and after a period of time in a room with a temperature of 75∘F. Suppose that data were collected for a random sample of 11 volunteers, where each difference is calculated by subtracting the heart rate in beats per minute in the 50∘F room from the heart rate in beats per minute in the 75∘F room. Assume that the populations are normally distributed. The physician uses the alternative hypothesis Ha:μd≠0. Suppose the test statistic t is computed as t≈5.627, which has 10 degrees of freedom. What range contains the p-value?Q1: Suppose data on root length (in mm) were obtained from roots from the three set-ups: (1) negative control; (2) positive control; (3) water sample of interest. Propose the inferential statistics used to analyze the data. Inferential Statistics
- The director of a shipping company believes that there is a relationship between the cost of a customer’s shipment (£) and the weight (lb) of the package being shipped. For investigating this possible relationship, a random sample of nine customer shipments was selected and the weight (in lb) and the cost (rounded to the nearest £) for each shipment were recorded. The results obtained are shown in the table below (on the picture). required: a) ) The scatter diagram showing the relationship between the cost of acustomer’s shipment (£) and the weight (lb) of the package being shipped, is given below. Comment fully and clearly on this diagram. i) ii)Show how the difference in mean estimands can be decomposed into the average treatment effect (ATE). Difference in mean estimand = E[Yi | Di = 1] - E[Yi | Di =0] ATE = E[Y1i - Y0i]=E[Ti]The control department of a light bulb manufacturer randomly picks 4400 light bulbs from the production lot every week. The records show that, when there is no malfunction, the defect rate in the manufacturing process (due to imperfections in the material used) is 1%. When 1.25% or more of the light bulbs in the sample of 4400 are defective, the control unit calls repair technicians for service. a)Find the mean of p, where p is the proportion of defective light bulbs in a sample of 4400 when there is no malfunction. b)Find the standard deviation of p. c)Compute an approximation for P≥p0.0125, which is the probability that the service technicians will be called even though the system is functioning properly. Round your answer to four decimal places.


