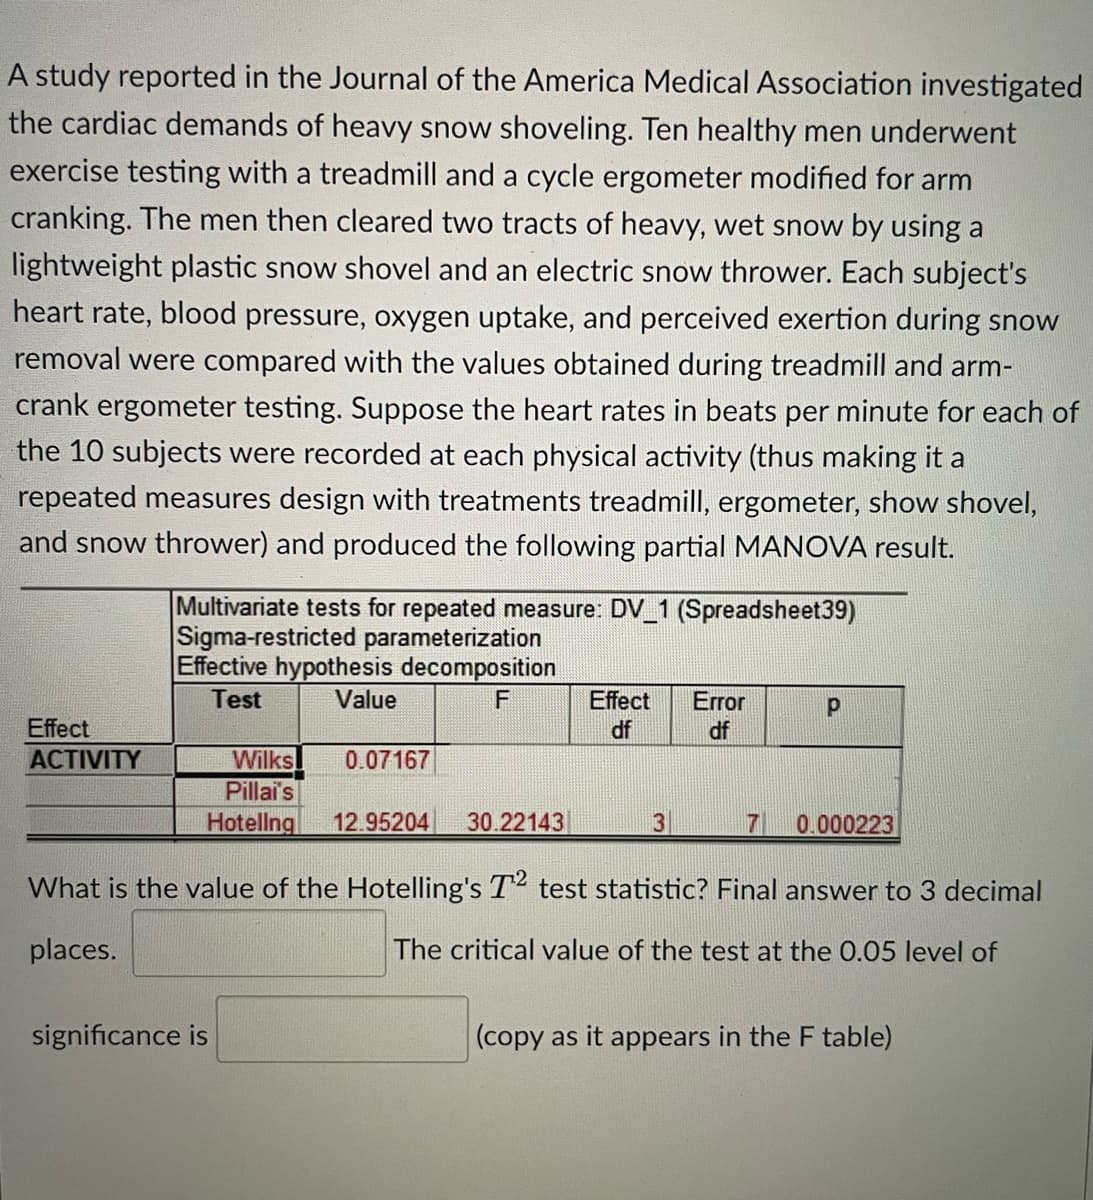
What is the value of the Hotelling's T2 test statistic? Final answer to 3 decimal places. The critical value of the test at the 0.05 level of significance is (copy as it appears in the F table)


Q: 1. Using the stratified sampling technique, compute for the sample size at a 5% margin of error for…
A:
Q: Please use the accompanying Excel data set or accompanying Text file data set when completing the…
A: Given n=10 Please use the accompanying Excel data set or accompanying Text file data set when…
Q: Drag the correct answer into the designated slot in the following distributions:
A: here use basic Property of Curve here in each curve mean are equal as curve wider , distribution…
Q: 5. Let X be a random variable with a uniform distribution on the interval (0,1). Given Y = e, derive…
A: Solution
Q: question 1: Explain the Discrete and Continuous Markov Chains. Discuss the models for the two chains…
A: Discrete-time Markov chain : A Discrete-Time Markov Chain can be used to describe the behavior of a…
Q: Example 3.1. Let the blood types of 40 persons are as follows: ΑΒΑ Ο Α Α Α ΟΒΟΒΟΟΑΟΟΑ Α Α Α AB ΑΒ Α…
A: Given data The blood types of 40 persons are as follows A B A O A A A O B O B O O A O…
Q: A random sample by the National Institutes of Health included 2253 men to determine the proportion…
A: Given x=986 n=2253
Q: a One Sample t-Test, the test variable's mean is compared against a ""test value"", which is a known…
A: T test : A stastical test for comprasion of means between two groups. Now if we will use t test for…
Q: Q1: The following frequency distribution represents the amount of sugar in g/l for a sample of…
A: Disclaimer: Since you have posted a question with multiple sub-parts, we will solve the first three…
Q: ride in a certain island. The table below shows the chlo 142 M (% of roadway area) y (chloride…
A: x y 1 0.19 4.4 2 0.7 10.6 3 0.47 11.8 4 0.78 14.7 5 0.69 19.2 6 1.06 27.7 7 0.15 6.6…
Q: Find the equation of the regression line for the given data. Then construct a scatter plot of the…
A: The following data has been provided: Height (x) stories (y) 774 51 625 47 521 45 508 41…
Q: Given the Ricker's model equation bel what would the graph look like (what a the properties of each…
A: u(0) = 2 k = 100 ut=er1-ut-1kut-1 Sample values are given as below: 2 k = 100 u(i) r =…
Q: Probabilities when events are dependent (for example sampling without replacement). A useful…
A: Given that: Number of first graders: 9 Number of second graders: 7 Number of third graders: 6 No two…
Q: se the correct histogram for this sample.
A: We need to produce a histogram of frequencies. These are the sample data that have been provided:…
Q: Determine whether or not students in the two 4th grade classes have the same average scores in math,…
A: Note: As per the guidelines, we are allowed to answer first question when multiple questions are…
Q: Question 10 The average and standard deviation of the weights of 350 Indian students are 55 kg and 3…
A:
Q: Assume that a randomly selected subject is given a bone density test. Those test scores are normally…
A: Assume that z is a random variable, which defines the bone density test score.
Q: Determine the following probabilities. Leave your answer as a percent to the nearest tenth (one…
A: Probability is the measure that denoted the chance of event happening. It take values ranges between…
Q: In a clinical trial of 734 subjects treated with medicine A, 29 reported headaches. In a control…
A: To calculate: The risk ratio
Q: A linear model was fit to predict weekly Sales of frozen pizza (in pounds) from the average Price…
A: The linear model, i.e., the regression line of y (i.e., the weekly sales) on x (i.e., the price of…
Q: b) The test statistic value is (two decimal places): c) Using the P-value method, the P-value is (4…
A:
Q: Using the counting rules, it is possible to compute probabilities of the form N(A)/N without a…
A: We know that the probability of any event means chance of happening of this event.
Q: Researchers are trying to determine if there is a difference in the average lifespan of two species…
A: It is interpreted that: For Ceratitis capitata:n1 sample size=105, x¯1 sample mean=50, s1sample…
Q: 4. (a) Indicate the kind of linearity (variables or parameters) the following equations exhibit: 1…
A: i) Linear in both parameters and variables. ii) Linear in variables. iii) Linear in parameters. iv)…
Q: why 1-0.08? Why did you use those spesific formulas?
A: Given that, The probability that an individual sample tests positive is, 0.08 The probability that…
Q: The test score data from the sample of trainees are as follows: 1. Was the knowledge (test score)…
A: Given information: μ=65n=24α=0.05
Q: 1) In a normal distribution, most participants fall within +/- 1 standard deviation from the mean.…
A: Disclaimer: Since you have asked multiple questions, we will solve the first question for you. If…
Q: Find the minimum sufficient statistic in the following situations. In order to establish minimality,…
A: Minimal sufficient statistics If a statistic T is minimal if for every sufficient…
Q: If a real number x is not a possible value for a random variable x, then it has a probability of…
A: A random variable is a variable that takes numerical values determined by the outcome of a random…
Q: Question 6 Karen wants to advertise how many chocolate chips are in each Big Chip cookie at her…
A:
Q: (a) Find the probability that the number that prefer to purchase electronics online is exactly five.…
A:
Q: Use the normal distribution curve to illustrate your answer. 1. The following simple random sample…
A: GIVEN:- A sample that follows normal distribution such as 4, 6, 3, 5, 9, 3. To construct a…
Q: A group of 7 students was asked. "How many hours did you watch television last week?" Here are their…
A: From the provided information, The data values are as follow: 14, 12, 9, 5, 5, 11, 6 Number of…
Q: Overproduction of uric acid in the body can be an indication of cell breakdown. This may be an…
A: Since you have posted a question with multiple sub-parts, we will solve first three subparts for…
Q: The method of tree ring dating gave the following years A.D. for an archaeological excavation site.…
A:
Q: The data table represents the measure of a variable before and after a treatment. Does the sample…
A: The following data has been provided: xi yi 39 40 31 31 51 49 47 46 39 31
Q: In a group of 5000 adults, 3500 are in favor of stricter gun control laws, 1200 are against such…
A:
Q: Researchers are trying to determine if there is a difference in the average lifespan of two species…
A: Given Information: Group 1: Sample size n1=105 Sample mean x¯1=51 Sample standard deviation s1=7…
Q: The probability of drawing a red face card from a deck of cards. Leave your answer as a percent to…
A: GivenTotal no.of cards in deck=52No.of red face cards = 6 (i.e., red king,red…
Q: Suppose x has a distribution with μ = 13 and σ = 9. USE SALT (a) If a random sample of size n = 31…
A: Given: μ=13σ=12 Formula: σx¯=σn
Q: The numbers of clients, during a special event, of several tourist agencies in 7 11 27 21 Luzon are…
A: Arrange the given data in ascending…
Q: Refer to the accompanying table, which describes results from groups of 8 births from 8 different…
A: From the provided information, Number of Girls (x) P (x) 0 0.006 1 0.031 2…
Q: The following data from Borislow show the changed response scores of three groups on the Edwards…
A: Given information: No. of groups=3n1=6n2=6n3=7N=19level of significance=0.05
Q: The table shows how 10 students were ranked according to their achievements in both the laboratory…
A: Given data indicates the ranks of 10 students according to their achievements in both laboratory…
Q: Find the area under the normal curve in each of the following cases: 1. Between z = 0 and 2 = 1.63…
A: we have to find area under the curve1.Between z=0 and…
Q: Suppose in a random sample of 246 individuals, 35 are considered success. Compute the margin of…
A: Here, Confidence level is given as 0.98. Thus, α=0.02 =1-0.98. From Standard normal distribution…
Q: Specific Directions for Capstone Assessment • Refer to this problem. The set of questions will be…
A: Answer: Independent variable(x) = Percentage of roadways area Dependent variable (y) = Chloride…
Q: 18. There was some concern that a drug used by some pregnant women for nausea might cause trouble…
A: Given Information: Number of women exposed to the drug is 1925 Number of women unexposed to the drug…
Q: 13) A group of medical researchers are developing a treatment program that is intended to reduce…
A:
Q: Consider the following multiple regression equation estimated with OLS. There are 2,467…
A: Obtain the 99% confidence interval for the coefficient b3. The 99% confidence interval for the…

Step by step
Solved in 3 steps with 2 images

- An automotive engineer is investigating two different types of metering devices for an electronic fuel injection system to determine whether they differ in their fuel mileage performance. The system is installed on 10 different cars, and a test is run with each metering device on each car. The data is provided below: Metering Device Car 1 2 1 17.6 16.8 2 19.4 20.0 3 18.2 17.6 4 17.1 16.4 5 15.3 16.0 6 15.9 15.9 7 16.3 16.5 8 18.0 18.4 9 17.3 16.4 10 19.1 20.1 Is there a significant difference between the means of the two metering devices? Use . Interpret the result in the context of the problem. An article in the journal Hazardous Waste and Hazardous Materials (Vol. 6, 1989) reported the results of an analysis of the weight of calcium in standard cement and cement doped with lead. Reduced levels of calcium would indicate that the hydration mechanism in the cement is blocked…Since its removal from the banned substances list in 2004 by the World Anti-Doping Agency,caffeine has been used by athletes with the expectancy that it enhances their workout andperformance. However, few studies look at the role caffeine plays in sedentary females.Researchers at the University of Western Australia conducted a test in which they determined therate of energy expenditure (kilojoules) on 10 healthy, sedentary females who were nonregularcaffeine users. Each female was randomly assigned either a placebo or caffeine pill (6mg/kg) 60minutes prior to exercise. The subject rode an exercise bike for 15 minutes at 65% of theirmaximum heart rate, and the energy expenditure was measured. The process was repeated on aseparate day for the remaining treatment. The mean difference in energy expenditure (caffeine –placebo) was 18kJ with a standard deviation of 19kJ. If we assume that the differences follow anormal distribution can it be concluded that that caffeine appears to increase…The director of an obesity clinic in a large northwestern city believes that drinking soft drinks contribute to obesity in children. To determine whether a relationship exists between these two variables, she conducts the following pilot study. Eight- 12-year-old male volunteers are randomly selected from children attending a local junior high school. Parents of the children are asked to monitor the number of soft drinks consumed by their child over a one week period. The children are weighed at the end of the week and their weights converted into body mass index (BMI) values. The BMI is a common index used to measure obesity and takes into account both height and weight. An individual is considered obese if they have a BMI value 30. The following data or collected: child. # of soft drinks consumed BMI 1 3 20 2 1 18 3…
- Research done at the Harvard School of Public Health showed that regular soda drinkers may have a tendency toward the weak and brittle bones associated with osteoporosis. They surveyed 2,622 women who were active athletes in college and classified them as to whether they regularly drank soft drinks or rarely drank soft drinks. The proportion of women in each group who suffered from bone fractures was determined. The findings: those who regularly drank soft drinks were twice as likely to suffer from bone fractures as those who rarely drank soft drinks. Source: Health and Fitness News Service, August 21, 1996. a. Was this an observational study or an experiment? Explain.b. What is the population under study?c. What was the explanatory variable?d. What was the response variable?e. What are some possible confounding variables in this study?The Diabetes Control and Complications trial research group, randomly assigned volunteers with type 1 (insulin-dependent) diabetes mellitus, but without retinopathy, either to a conventional treatment or to a more intensive treatment aimed at maintaining normal blood glucose levels. The volunteers' health was monitored closely for approximately six years. By the end of the study, 91 patients out of 378 in the conventional treatment group had developed retinopathy, whereas 23 out of 348 in the intensive treatment group had developed retinopathy. Test whether the rates of retinopathy differed significantly between the two treatment groups, if they did, which rate was significantly lower. 1. Provide the null hypothesis 2. Provide the alternative hypotheses 3. calculate the appropriate test statistic. Show all work 4. Identify the p-value for that test statistic 5. Using the p-value method and an alpha level of 0.02 state what your conclusions are regarding the null hypothesis, and…The Diabetes Control and Complications trial research group, randomly assigned volunteers with type 1 (insulin-dependent) diabetes mellitus, but without retinopathy, either to a conventional treatment or to a more intensive treatment aimed at maintaining normal blood glucose levels. The volunteers' health was monitored closely for approximately six years. By the end of the study, 91 patients out of 378 in the conventional treatment group had developed retinopathy, whereas 23 out of 348 in the intensive treatment group had developed retinopathy. Test wether the rates of retionpathy differed significantly betweenthe two treatment groups, if they did, which rate was significantly lower. 1. Provide the null hypothesis 2. Provide the alternative hypotheses 3. calculate the appropriate test statistic. Show all work 4. Indentify the p-value for that test statistic 5. Using the p-vlaue method and an alpha level of 0.02 state what your conclusions is regarding the null hypothesis, and…
- A low-level CDC bureaucrat wants to please his boss by gathering evidence thatthe current government-mandated shutdown of society is not causing people’s mentalhealth to deteriorate, so that it can safely be continued for several years if anyexpert says it’s necessary.He polls a random sample of 1600 citizens, gathering data on such items asincome loss, weight gain, access to toilet paper, hours spent binge-watchingNetflix, and number of injuries caused by household fights, and compiles all thisinto a scientifically-weighted “misery index”.The mean misery index from the sample is 99.2; it seems reasonable to use apopulation standard deviation σ = 19.1.a) Does this information provide significant evidence (at the 5% level) that thenationwide mean misery index is less than 100? Set up appropriate null andalternative hypotheses, calculate the appropriate test statistic, find the P-value,and state your conclusion. (10)b) A CDC press release publishing the results of this study claims that…A low-level CDC bureaucrat wants to please his boss by gathering evidence thatthe current government-mandated shutdown of society is not causing people’s mentalhealth to deteriorate, so that it can safely be continued for several years if anyexpert says it’s necessary.He polls a random sample of 1600 citizens, gathering data on such items asincome loss, weight gain, access to toilet paper, hours spent binge-watchingNetflix, and number of injuries caused by household fights, and compiles all thisinto a scientifically-weighted “misery index”.The mean misery index from the sample is 99.2; it seems reasonable to use apopulation standard deviation σ = 19.1.a) Does this information provide significant evidence (at the 5% level) that thenationwide mean misery index is less than 100? Set up appropriate null andalternative hypotheses, calculate the appropriate test statistic, find the P-value,and state your conclusion. b) A CDC press release publishing the results of this study claims that…Is injecting medical cement effective in reducing pain for people who have suffered fractured vertebrae? A paper describes an experiment to compare patients who underwent vertebroplasty (the injection of cement) to patients in a placebo group who underwent a fake procedure. Because the placebo procedure was similar to the vertebroplasty procedure except for the actual injection of cement, patients participating in the experiment were not aware of which treatment they received. All patients were asked to rate their pain at three different times—3 days, 14 days, and 1 month after the procedure. Summary statistics are given in the accompanying table. Pain Intensity VertebroplastyGroup Placebo Group n = 73 n = 76 mean sd mean sd 3 days 4.2 2.8 3.9 2.9 14 days 4.3 2.9 4.5 2.8 1 month 3.9 2.9 4.6 3.0 (a) Construct a 95% confidence interval for the difference in mean pain intensity between the two treatments at 14 days after treatment. (Use ?Vertebroplasty −…
- Does posting calorie content for menu items affectpeople’s choices in fast-food restaurants? According to results obtained by Elbel, Gyamfi, and Kersh(2011), the answer is no. The researchers monitoredthe calorie content of food purchases for children andadolescents in four large fast-food chains before andafter mandatory labeling began in New York City. Although most of the adolescents reported noticing thecalorie labels, apparently the labels had no effect ontheir choices. Data similar to the results obtained showan average of M = 786 calories per meal with s =85 for n =100 children and adolescents before thelabeling, compared to an average of M = 772 calorieswith s = 91 for a similar sample of n = 100 after themandatory posting.a. Use a two-tailed test with a = .05 to determinewhether the mean number of calories after theposting is significantly different than before caloriecontent was posted.b. Calculate r2to measure effect size for the mean difference.A heart study objective was to study heart disease among healthy volunteers.After a 10-year follow-up period involving men aged 40 to 59, there were 16 casesof coronary heart disease (CHD) among the 454 men who initially had cholesterollevels below 210 mg/100 ml (referred to as the low serum cholesterol group). Incontrast, among the 424 men whose initial cholesterol levels were at least 245mg/100 ml (referred to as the high serum cholesterol group), there were 51 cases ofCHD. With this information, Draw a 2x2 contingency table then calculate the relative risk (RR) associated with high serum cholesterol and provide an interpretation of the result.Suppose that, as part of a research methods class, Bailey was asked to write a summary of a research paper on the topic of the effects of oil contamination in soil on seed germination rates. Identify the explanatory and the response variables.
