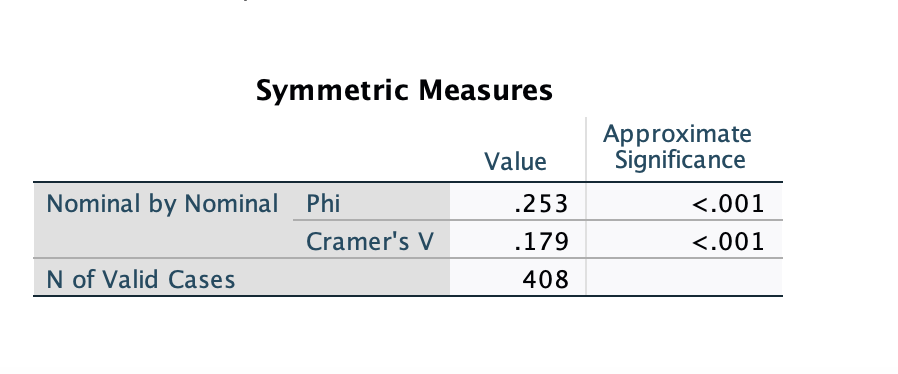
What is this information communicating about the effect size.


Q: i need a scattergraph done.
A: A scatter plot is a graphical representation which shows the relationship between two variables.
Q: (a) Consider a t distribution with 29 degrees of freedom. Compute P(t≤1.10). Round your answer to at…
A: The degrees of freedom is 29.The required probability is
Q: f(x) = = 0.475 0 0.075x 0.075.x for 1 ≤ x ≤ 5 elsewhere The probablity density function for…
A: From the provided information,The probability density function is as follow:
Q: Find the indicated area under the standard normal curve. Between z=−1.21 and z=1.21
A:
Q: wers players' IQs. The soccer players were divided into two groups, based on whether they averaged…
A: We have:-i = 1,2nFewer than 10 Headers33108910 or more Headers27997
Q: (d) Explain why the confidence intervals obtained in parts (b) and (c) are different. Choose the…
A: For sample 1 : 95% of confidence interval is (4.99 ,5.97 )For sample 2 : 95% of confidence interval…
Q: Use z scores to compare the given values. Based on sample data, newborn males have weights with a…
A: Based on sample data, newborn males have weights with a mean of = 3263.8 g and a standard deviation…
Q: Find the z-scores that bound the middle 80% of the area under the standard normal curve. O-1.23,…
A: The objective is to obtain the z-score values, that include the middle 80% of the area. Considering…
Q: Suppose that you were interested in investigating the effect of a drug that is to be used in the…
A: Paired test:A paired test or a dependent test statistical test that compares the averages or means…
Q: Use the body table to find the specified z-number. (Enter your answers to two decimal places.)
A: By using the z-body table.
Q: How does k=.067?
A: Since we want to find the z-score for the 75th percentile (top 25 percent), we need to find the…
Q: The following data sets represent simple random samples from a population whose mean is 100.…
A: We have given data set IIAfter removing 106 to 61 the data set II…
Q: Determine the point estimate of the population mean and margin of error for the confidence interval…
A:
Q: A manufacturer knows that their items have a normally distributed lifespan, with a mean of 13.9…
A: Mean()=13.9Standard deviation()=3.7
Q: iven the data 6,10,8,5,11,6,7,12,11,11,9,6 write the expression you would use to find standar devia
A: the data 6,10,8,5,11,6,7,12,11,11,9,6Sample size n=12the standard deviation is gievn by
Q: The accompanying data represent the total travel tax (in dollars) for a 3-day business trip in 8…
A: Dataset has been provided:67.91, 78.59, 69.93, 82.68, 79.72, 87.22, 100.66, 99.1199% confidence…
Q: (d) If the sample size is 16, what conditions must be satisfied to compute the confidence interval"…
A: n = 16
Q: The respondents to the 2018 General Social Survey reported their weekly hours on the internet. The…
A: Please note that as per our guidelines if multiple sub-parts are there in a question we can answer…
Q: In the game of roulette, a wheel consists of 38 slots numbered 0, 00, 1. 2. 36. To play the game, a…
A: From the part (b) we have Where is the mean of the individual game outcomes, is the standard…
Q: W Use the accompanying radiation levels in kg W kg Click the icon to view the radiation levels.…
A: The data table cotaining radiation levels of different cell phones is provided in the question.
Q: The Cadet is a popular model of sport utility vehicle, known for its relatively high resale value.…
A:
Q: Suppose you wish to find out the answer to the age-old question, "Do people prefer Cola 1 or Cola…
A: The level of significance is, = 0.05The critical value corresponding to 0.05 level of significance…
Q: 1) What is the highest relative score of the three (3) scores below? Use the Z value to answer. a) a…
A: The means, standard deviations and X values are given to identify the highest relative score.
Q: One year, the mean age of an inmate on death row was 41.1 years. A sociologist wondered whether the…
A: Sample size n=32
Q: Scott Bell Builders would like to predict the total number of labor hours spent framing a house (Y)…
A: Number of labor hours, XSquare footage in 100s, Y20032213332792416531173221913119620
Q: a) State the random variables. rv X = Select an answer of Select an answer rv Y = Select an answer…
A: In the given example we need to indentify the random variables. Symbol for the correlation…
Q: The problem facing a manager is to assess the impact of factors on full-time job growth.…
A:
Q: Formula to find expected frequency for test of independence of attributes is Select one: O a. E=(Row…
A: Formula to find expected frequency for test of independence of attributes is (a) E = (Row…
Q: Consider the following null Hypothesis: Ho: u≤28 A sample with x=28.9, o-2, n-36 Assuming a=0.05…
A: The given hypothesis is: H0:μ≤28.The sample mean, x¯=28.9.The sample standard deviation, σ=2.The…
Q: 3. Let (Sn)nzo be a simple symmetric random walk. Compute P(Sn = y Sm = x) for the two cases n > m…
A: In this problem, we are dealing with a simple symmetric random walk denoted by .The random walk…
Q: A vertical line is drawn through a normal distribution at z = 0.80. What proportion of the…
A:
Q: Hip surgery: In a sample of 129 hip surgeries, the average surgery time was 138.1 minutes with a…
A: From the provided information,Sample size (n) = 129Sample mean x̅ = 138.1 minutesStandard deviation…
Q: In 2015, the average iceberg weighed 20 million tons. A random sample of 100 icebergs last year had…
A: From the provided information,Standard deviation (s) = 5.7Sample mean (x̄) = 19Sample size (n) =…
Q: You plan to conduct a survey to find what proportion of the workforce has two or more jobs. You…
A: Suppose p is the true population proportion of workforce has two or more jobs.
Q: 1.)The scores on the Wechsler Adult Intelligence Scale are approximately Normal with μ = 100 and σ =…
A: “Since you have posted multiple questions, we will provide the solution only to the first five…
Q: The following data show the of number of shoes (in 1000 units) sold by a new shoe…
A: The given data set…
Q: Below are bivariate data giving birthrate and life expectancy information for each of twelve…
A: We need to calculate the sample correlation coefficient.
Q: xperience has indicated that the standard deviation of strength is 2 psi. A random sample of nine…
A:
Q: According to a survey in a country, 38% of adults do not own a credit card Suppose a simple random…
A: = 0.38 = 0.022Random sample = 500We have to find the probability that in a random sample of 500…
Q: Problem 18-28 (Algo) The following are historical demand data: YEAR SEASON 2011 Spring Summer Fall…
A: YearSeasonActual Demand2011Spring204Summer150Fall374Winter5722012Spring474Summer274Fall675Winter964
Q: Following are the quantities and prices for the years 2010 and 2018 for Kinzua Valley Geriatrics.…
A: 2010 (Base Year)2018 (Current year)ItemPrice (po)Quantity (qo)Price (p1)Quantity (q1)Syringes…
Q: Formula to find expected frequency for test of independence of attributes is Select one: a. E=(Row…
A: The independence of attributes concept is associated with validating if two categorical variables…
Q: Please do not give solution in image format thanku
A: The passage you gave seems to have something to do with experimental planning and potential risks to…
Q: Compute the critical value Za/2 that corresponds to a 83% level of confidence. Click here to view…
A:
Q: (d) What is the confidence level of a confidence interval for if its lower limit is and the upper…
A: From previous parts, the 95% confidence interval for is given as:Lower confidence limit = 0.01258…
Q: A trend is the better fitted trend for which the sum of squares of residuals is: Select one: a.…
A: Concept of regression analysis is discussed:The sum of squares of residuals represents the…
Q: Using regression software, the trend component for this series is: Sales = 1322 +50.7x. The…
A: The trend-season model is:Sales = (1322+ 50.7x) * SFSeasonality factors for first, second, third and…
Q: A psychologist is interested in the mean IQ score of a given group of children. It is known that the…
A: A psychologist is interested in the mean IQ score of a given group of children.The standard…
Q: A sample of blood pressure measurements is taken for a group of adults, and those values (mm Hg) are…
A: Systolic, x11813015697157120115138126120
Q: A student survey was conducted in a major university, where data were collected from a random sample…
A: Given data contains Opposite sex/same sex/no difference" is a categorical variable with three…
What is this information communicating about the effect size.

Step by step
Solved in 3 steps with 5 images

- Find the positive geometric mean between 4 and 64.Matt thinks that he has a special relationship with the number 1. In particular, Matt thinks that hewould roll a 1 with a fair 6-sided die more often than you'd expect by chance alone. Suppose p is the trueproportion of the time Matt will roll a 1.(a) State the null and alternative hypotheses for testing Matt's claim. (Type the symbol "p" for thepopulation proportion, whichever symbols you need of "<", ">", "=", "not =" and express any values as afraction e.g. p = 1/3)HH.(b) Now suppose Matt makes n = 46 rolls, and a 1 comes up 10 times out of the 46 rolls. Determine the P-value of the test:P-value =(c) Answer the question: Does this sample provide evidence at the 5 percent level that Matt rolls a 1 moreoften than you'd expect?(Type: Yes or No)A pharmacist received a prescription for a patient with rheumatoid arthritis calling for eight divided powders. The contents of which were to weigh 1 gram. To check his skill, he removed the contents from each paper after filling the prescription by the block and divide method. Then each of the divided powders were weighed as: 1.05, 0.89, 0.98, 1.02, 1.01, 0.94, 1.03 and 0.99. 5. From the computed arithmetic mean, what will be the computed percentage error. 6. What is the summation of the differences of the values of x? * 7. What is the computed mean deviation? * 8. What is the summation of the square of the differences of the values of x? * 9. What will be the denominator used in the formula in the computation for the standard deviation in this activity? 10. What is the computed standard deviation?
- by Monge'sLet X be the outcome of tossing a fair die and Y be the outcome of tossing a fair coin.Find Var(X+ Y) (Correct upto 2 decimal points).)Matt thinks that he has a special relationship with the number 1. Inparticular, Matt thinks that he would roll a 1 with a fair 6-sided die more often thanyou'd expect by chance alone. Suppose p is the true proportion of the time Mattwill roll a 1.(a) State the null and alternative hypotheses for testing Matt's claim. (Type thesymbol "p" for the population proportion, whichever symbols
- An investment company advertised that last year its clients, on average, made a profit of 9% . Assuming that average refers to the mean, which of the following claims must be true based on this information? Note: More than one statement could be true. If none of the statements is true, mark the appropriate box. Last year more than half of their clients made a profit of at least 9% . Last year at least one of their clients made a profit of exactly 9% . Last year at least one of their clients made a profit of 9% or more. Two years ago some of their clients made a profit of at least 9% . Last year all of their clients made a profit of less than 16% . None of the above statements is true.Classify the following statements as to whether they belong to the area ofdescriptive statistics or inferential statistics___________________ 1. At most 5% of SLU students are smokers.___________________ 2. Assuming that less than 20% of the Kalinga coffee beans weredestroyed by a typhoon these past months, we should expect anincrease of no more than P30 for a kilogram of coffee by the endof the year. ___________________ 3. An employee generalized that the average monthly salary of a regular employee in a certain company is P12,000. ___________________ 4. A study found out that all customers who have received a giftcertificate from a store 75% went back to the store to shop.___________________ 5. The average grade in statistics of 50 students is 83.60.An investment company advertised that last year its clients, on average, made a profit of 7% . Assuming that average refers to the mean, which of the following claims must be true based on this information? Note: More than one statement could be true. If none of the statements is true, mark the appropriate box. Last year fewer than half of their clients made a profit of 7% or less. Last year at least one of their clients made a profit of 7% or more. Last year at least one of their clients made a profit of exactly 7% . Last year some of their clients made a profit of more than 3% . This year some of their clients will make a profit of at least 7% . None of the above statements are true.
- We wish to demonstrate that the average time to graduate from school is afected by the students who have taken AP calculus in hgh school. Specially, we wish to demonstrate the students who have taken AP calculus in high school graduate an average of more than .25 years sooner than students who have not taken AP calculus in high school. If we let μ1 denote the average time to graduate for students who have not taken AP calculus and μ2 dentoe the average time to graduate for students who have taken AP calculus, what is the apropriate null hypothesisExpress the null and alternative hypotheses in symbolic form for this claim: the mean weight of male dancers in a local modern dance company is less than 174 lbs. Note that the mean weight in the sample taken is 165 lbs.H0:μH1:μUse the following codes to enter the following symbols: ≥ enter >= ≤ enter <= ≠ enter !=If your numerical answer is NOT an integer, put it in percentage and rounded to 2 decimal places. For example, if the answer is 0.22575 , you have to put 22.58% in the box. DO NOT FORGET TO PUT THE PERCENT (%) SIGN AT LAST. Putting only 22.58 without the trailing percent sign will be assessed as a wrong answer! You must NOT type any other symbol, space, operator, fraction etc in the box. Suppose, you are running an experiment that has two outcomes, namely 'success' and 'failure'. You intially don't know the probability of success in a single experiment. But you know that, if you continue to run the experiment several times, the expected number of experiment required for the first success is 8. What is the standard deviation of the number of experiments required for the first success?