What percentage of ACT composite scores are below 31? Recall the following: For the ACT, the mean composite score was 21.0 with a standard deviation of 5.2 A. 23.89 % B. 84.85 % C. 37.45 % D. 97.25 %
What percentage of ACT composite scores are below 31? Recall the following: For the ACT, the mean composite score was 21.0 with a standard deviation of 5.2 A. 23.89 % B. 84.85 % C. 37.45 % D. 97.25 %

MATLAB: An Introduction with Applications
6th Edition
ISBN:9781119256830
Author:Amos Gilat
Publisher:Amos Gilat
Chapter1: Starting With Matlab
Section: Chapter Questions
Problem 1P

Related questions
Question
What percentage of ACT composite scores are below 31?
Recall the following:
- For the ACT, the mean composite score was 21.0 with a standard deviation of 5.2
A. 23.89 %
B. 84.85 %
C. 37.45 %
D. 97.25 %
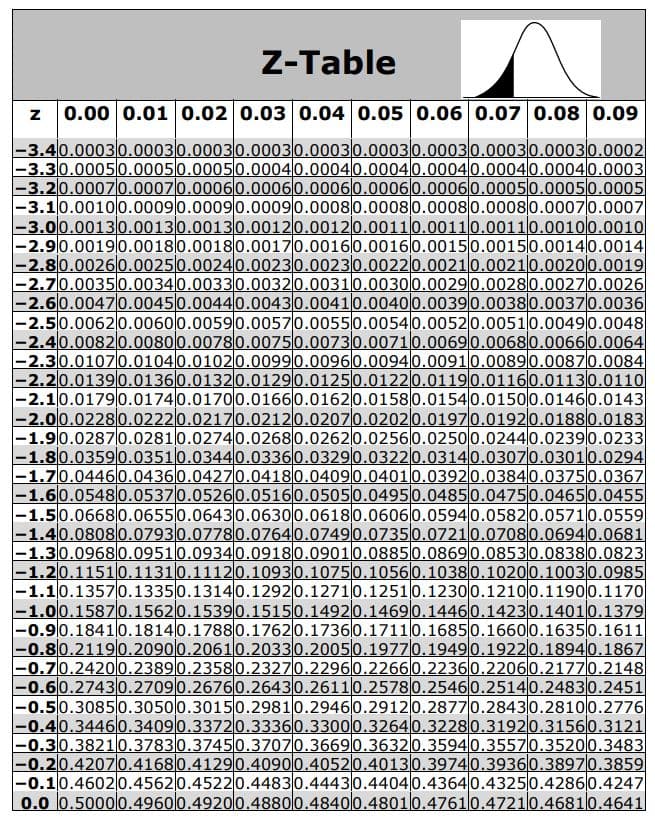
Transcribed Image Text:Z-Table
z 0.00 0.01 0.02 0.03 0.04 0.05 0.06 0.07 0.08 0.09
-3.40.0003 0.0003 0.00030.00030.0003 0.0003 0.0003 0.0003 0.00030.0002
-3.30.0005 0.0005 0.00050.00040.00040.0004 0.0004 0.00040.0004 0.0003
-3.20.00070.00070.00060.00060.00060.0006 0.00060.00050.0005 0.0005
-3.10.00100.00090.00090.00090.00080.0008 0.0008 0.00080.00070.0007
-3.00.00130.00130.00130.00120.00120.00110.00110.00110.00100.0010
-2.90.00190.0018 0.0018 0.00170.00160.0016 0.00150.00150.00140.0014
-2.80.00260.00250.00240.00230.0023 0.0022 0.00210.00210.00200.0019
-2.70.00350.00340.00330.00320.00310.00300.00290.00280.00270.0026
-2.60.00470.00450.00440.00430.0041 0.00400.00390.00380.00370.0036
-2.50.00620.00600.00590.00570.0055 0.00540.0052 0.00510.00490.0048
-2.40.00820.00800.00780.00750.00730.00710.00690.00680.00660.0064
-2.30.01070.0104 0.01020.00990.00960.0094 0.0091 0.00890.00870.0084
-2.20.0139 0.01360.0132 0.01290.0125 0.01220.01190.01160.01130.0110
-2.10.01790.01740.01700.01660.01620.01580.01540.01500.01460.0143
-2.00.02280.02220.02170.02120.02070.02020.01970.01920.01880.0183
-1.90.02870.02810.02740.0268 0.02620.0256 0.02500.02440.02390.0233
-1.80.03590.03510.03440.03360.03290.03220.03140.03070.03010.0294
-1.70.04460.04360.04270.04180.04090.04010.0392 0.03840.03750.0367
-1.60.05480.05370.05260.05160.05050.0495 0.04850.04750.04650.0455
-1.50.06680.0655 0.06430.06300.06180.06060.0594 0.05820.05710.0559
-1.40.08080.07930.07780.07640.07490.07350.07210.07080.06940.0681
-1.30.09680.09510.09340.09180.09010.08850.08690.08530.08380.0823
-1.20.11510.11310.11120.10930.10750.10560.10380.10200.10030.0985
-1.10.13570.13350.13140.12920.12710.1251 0.1230 0.12100.11900.1170
-1.00.15870.15620.15390.15150.14920.14690.14460.14230.14010.1379
-0.90.18410.18140.17880.17620.17360.17110.1685 0.16600.16350.1611
-0.80.21190.2090 0.20610.20330.20050.1977 0.19490.19220.18940.1867
-0.70.24200.23890.23580.23270.22960.22660.22360.22060.21770.2148
-0.60.27430.27090.26760.26430.26110.25780.25460.25140.24830.2451
-0.50.30850.30500.30150.29810.29460.29120.28770.28430.28100.2776
-0.40.34460.34090.33720.33360.33000.32640.32280.31920.31560.3121
-0.30.38210.37830.37450.37070.36690.36320.35940.35570.35200.3483
-0.20.42070.41680.41290.40900.40520.40130.39740.39360.38970.3859
-0.10.46020.45620.45220.44830.44430.44040.43640.43250.42860.4247
0.0 0.50000.49600.49200.48800.48400.4801 0.47610.47210.46810.4641
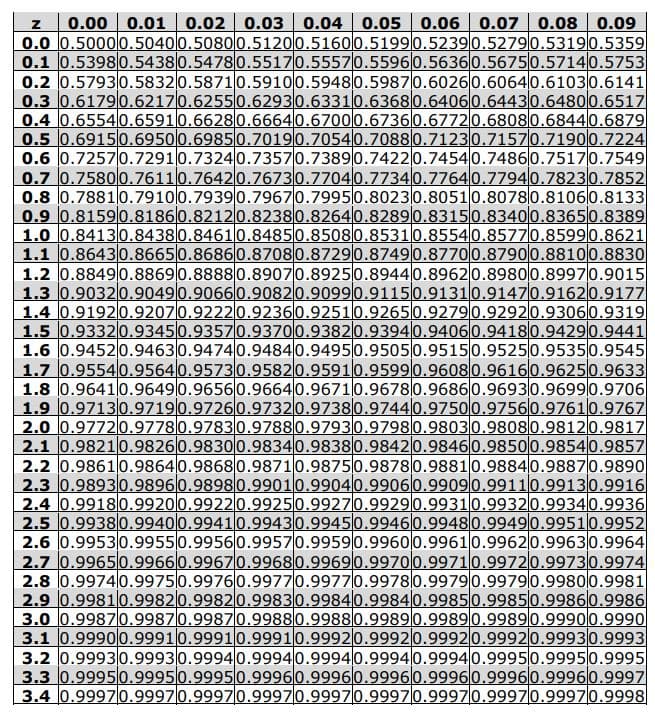
Transcribed Image Text:z 0.00 0.01 0.02 0.03 0.04 0.05 0.06 0.07 0.08 0.09
0.0 0.50000.50400.50800.51200.51600.51990.52390.52790.53190.5359
0.1 0.5398 0.5438 0.54780.55170.55570.55960.56360.56750.57140.5753
0.2 0.57930.58320.58710.59100.59480.59870.60260.60640.61030.6141
0.3 0.61790.62170.62550.62930.63310.63680.64060.64430.64800.6517
0.4 0.65540.65910.66280.66640.67000.67360.67720.68080.68440.6879
0.5 0.69150.69500.69850.70190.70540.70880.71230.71570.71900.7224
0.6 0.7257 0.72910.73240.73570.73890.7422 0.74540.74860.75170.7549
0.7 0.75800.76110.76420.76730.77040.77340.77640.77940.78230.7852
0.8 0.78810.79100.79390.79670.79950.80230.80510.80780.81060.8133
0.9 0.81590.81860.82120.82380.82640.82890.83150.83400.83650.8389
1.0 0.84130.84380.84610.84850.85080.85310.85540.85770.85990.8621
1.1 0.86430.86650.86860.87080.87290.87490.87700.87900.88100.8830
1.2 0.88490.88690.88880.89070.89250.89440.89620.89800.89970.9015
1.3 0.90320.90490.90660.90820.90990.91150.91310.91470.91620.9177
1.4 0.91920.92070.92220.92360.92510.92650.92790.92920.93060.9319
1.5 0.93320.93450.93570.93700.93820.93940.94060.94180.94290.9441
1.6 0.94520.94630.94740.94840.94950.95050.95150.95250.95350.9545
1.7 0.95540.95640.95730.95820.95910.95990.96080.96160.96250.9633
1.8 0.96410.96490.96560.96640.96710.96780.96860.96930.96990.9706
1.9 0.97130.97190.97260.97320.97380.97440.97500.97560.97610.9767
2.0 0.97720.97780.97830.97880.97930.97980.98030.98080.98120.9817
2.1 0.98210.9826 0.98300.98340.98380.98420.98460.98500.98540.9857
2.2 0.98610.98640.98680.98710.98750.98780.98810.98840.98870.9890
2.3 0.9893 0.98960.98980.99010.99040.99060.99090.99110.99130.9916
2.4 0.99180.99200.99220.99250.99270.99290.99310.99320.99340.9936
2.5 0.9938 0.99400.99410.99430.99450.99460.99480.99490.99510.9952
2.6 0.99530.99550.99560.99570.99590.99600.99610.99620.99630.9964
2.7 0.99650.99660.99670.99680.99690.99700.99710.99720.99730.9974
2.8 0.99740.99750.99760.99770.99770.9978 0.99790.9979l0.99800.9981
2.9 0.99810.99820.99820.99830.99840.99840.99850.99850.99860.9986
3.0 0.99870.99870.99870.99880.99880.99890.99890.99890.99900.9990
3.1 0.99900.9991 0.99910.99910.99920.99920.99920.99920.99930.9993
3.2 0.99930.99930.99940.99940.99940.99940.99940.99950.99950.9995
3.3 0.99950.99950.99950.99960.99960.9996 0.99960.99960.99960.9997
3.4 0.9997 0.9997 0.9997 0.99970.99970.9997 0.9997 0.99970.9997 0.9998
Expert Solution
This question has been solved!
Explore an expertly crafted, step-by-step solution for a thorough understanding of key concepts.

This is a popular solution!

Trending now
This is a popular solution!

Step by step
Solved in 2 steps

Recommended textbooks for you
MATLAB: An Introduction with Applications
Statistics
ISBN:
9781119256830
Author:
Amos Gilat
Publisher:
John Wiley & Sons Inc

Probability and Statistics for Engineering and th…
Statistics
ISBN:
9781305251809
Author:
Jay L. Devore
Publisher:
Cengage Learning

Statistics for The Behavioral Sciences (MindTap C…
Statistics
ISBN:
9781305504912
Author:
Frederick J Gravetter, Larry B. Wallnau
Publisher:
Cengage Learning
MATLAB: An Introduction with Applications
Statistics
ISBN:
9781119256830
Author:
Amos Gilat
Publisher:
John Wiley & Sons Inc
Probability and Statistics for Engineering and th…
Statistics
ISBN:
9781305251809
Author:
Jay L. Devore
Publisher:
Cengage Learning
Statistics for The Behavioral Sciences (MindTap C…
Statistics
ISBN:
9781305504912
Author:
Frederick J Gravetter, Larry B. Wallnau
Publisher:
Cengage Learning

Elementary Statistics: Picturing the World (7th E…
Statistics
ISBN:
9780134683416
Author:
Ron Larson, Betsy Farber
Publisher:
PEARSON

The Basic Practice of Statistics
Statistics
ISBN:
9781319042578
Author:
David S. Moore, William I. Notz, Michael A. Fligner
Publisher:
W. H. Freeman

Introduction to the Practice of Statistics
Statistics
ISBN:
9781319013387
Author:
David S. Moore, George P. McCabe, Bruce A. Craig
Publisher:
W. H. Freeman