The following table shows predicted product demand using your particular forecasting method along with the actual demand that occurred: FORECAST ACTUAL 1,515 1,585 1,415 1,515 1,715 1,615 1,755 1,680 1,805 1,730 Compute the tracking signal using the mean absolute deviation and running sum of forecast errors.
The following table shows predicted product demand using your particular forecasting method along with the actual demand that occurred: FORECAST ACTUAL 1,515 1,585 1,415 1,515 1,715 1,615 1,755 1,680 1,805 1,730 Compute the tracking signal using the mean absolute deviation and running sum of forecast errors.

Algebra & Trigonometry with Analytic Geometry
13th Edition
ISBN:9781133382119
Author:Swokowski
Publisher:Swokowski
Chapter10: Sequences, Series, And Probability
Section10.8: Probability
Problem 31E

Related questions
Question
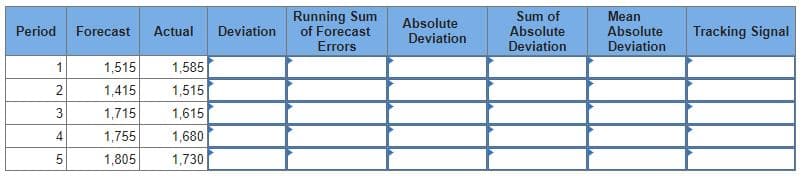
The following table shows predicted product demand using your particular forecasting method along with the actual demand that occurred:
| FORECAST | ACTUAL |
| 1,515 | 1,585 |
| 1,415 | 1,515 |
| 1,715 | 1,615 |
| 1,755 | 1,680 |
| 1,805 | 1,730 |
Compute the tracking signal using the mean absolute deviation and running sum of forecast errors.
Transcribed Image Text:Running Sum
of Forecast
Errors
Absolute
Deviation
Sum of
Absolute
Deviation
Mean
Absolute
Deviation
Period
Forecast
Actual
Deviation
Tracking Signal
1
1,515
1,585
2
1,415
1,515
3
1,715
1,615
4
1,755
1,680
5
1,805
1,730
Expert Solution
This question has been solved!
Explore an expertly crafted, step-by-step solution for a thorough understanding of key concepts.

This is a popular solution!

Trending now
This is a popular solution!

Step by step
Solved in 2 steps

Recommended textbooks for you
Algebra & Trigonometry with Analytic Geometry
Algebra
ISBN:
9781133382119
Author:
Swokowski
Publisher:
Cengage
Algebra & Trigonometry with Analytic Geometry
Algebra
ISBN:
9781133382119
Author:
Swokowski
Publisher:
Cengage