) What percentage of scores was (1) predicted to fall and (2) actually fell within ±1 SD for ADHD? Choices: 1. 34% and 29% 2. 54% and 64% 3. 62% and 68% 4. 68% and 62%
) What percentage of scores was (1) predicted to fall and (2) actually fell within ±1 SD for ADHD? Choices: 1. 34% and 29% 2. 54% and 64% 3. 62% and 68% 4. 68% and 62%

Glencoe Algebra 1, Student Edition, 9780079039897, 0079039898, 2018
18th Edition
ISBN:9780079039897
Author:Carter
Publisher:Carter
Chapter4: Equations Of Linear Functions
Section: Chapter Questions
Problem 8SGR

Related questions
Question
1) What percentage of scores was (1) predicted to fall and (2) actually fell within ±1 SD for ADHD?
Choices:
1. 34% and 29%
2. 54% and 64%
3. 62% and 68%
4. 68% and 62%
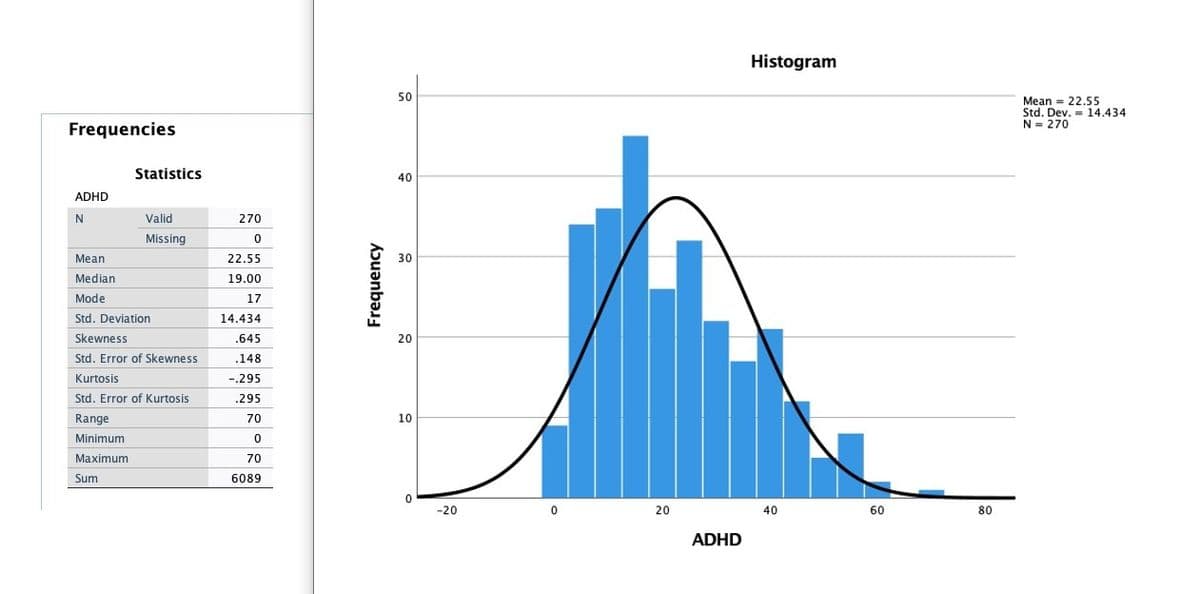
Transcribed Image Text:Histogram
50
Mean = 22.55
Std. Dev. = 14.434
N = 270
Frequencies
Statistics
40
ADHD
Valid
270
Missing
0
Mean
22.55
30
Median
19.00
Mode
17
Std. Deviation
14.434
Skewness
.645
20
Std. Error of Skewness
.148
Kurtosis
-.295
Std. Error of Kurtosis
.295
Range
70
10
Minimum
Maximum
70
Sum
6089
-20
20
40
60
80
ADHD
Frequency

Expert Solution
This question has been solved!
Explore an expertly crafted, step-by-step solution for a thorough understanding of key concepts.

This is a popular solution!

Trending now
This is a popular solution!

Step by step
Solved in 2 steps with 2 images

Recommended textbooks for you
Glencoe Algebra 1, Student Edition, 9780079039897…
Algebra
ISBN:
9780079039897
Author:
Carter
Publisher:
McGraw Hill
Glencoe Algebra 1, Student Edition, 9780079039897…
Algebra
ISBN:
9780079039897
Author:
Carter
Publisher:
McGraw Hill