What test should I use for this problem?

Linear Algebra: A Modern Introduction
4th Edition
ISBN:9781285463247
Author:David Poole
Publisher:David Poole
Chapter2: Systems Of Linear Equations
Section2.4: Applications
Problem 2EQ: 2. Suppose that in Example 2.27, 400 units of food A, 500 units of B, and 600 units of C are placed...

Related questions
Question
What test should I use for this problem?
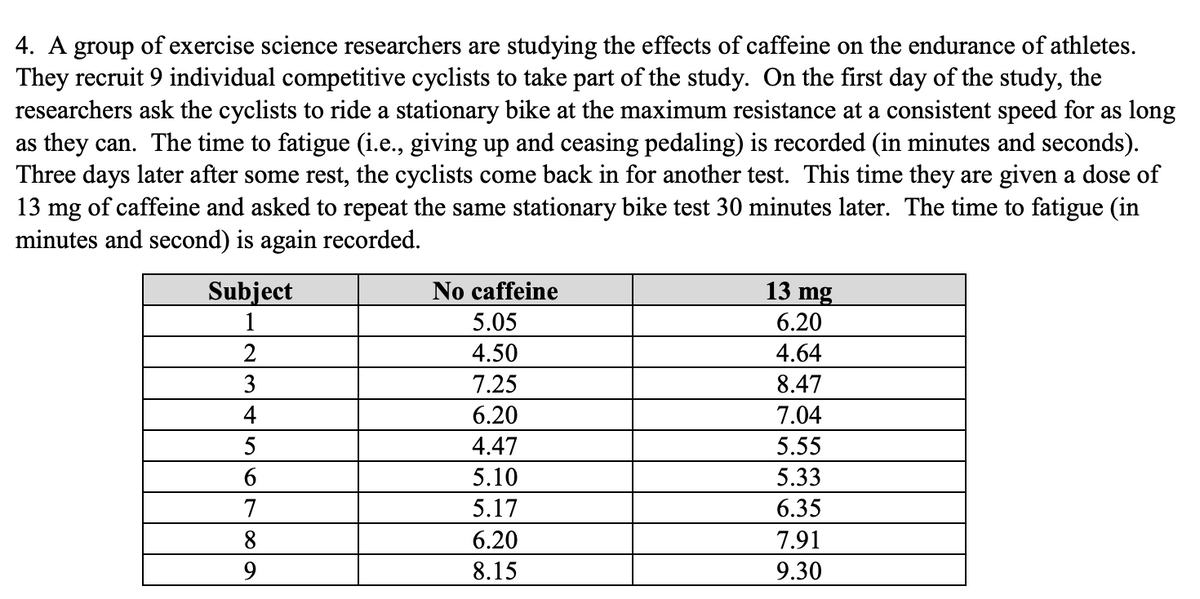
Transcribed Image Text:4. A group of exercise science researchers are studying the effects of caffeine on the endurance of athletes.
They recruit 9 individual competitive cyclists to take part of the study. On the first day of the study, the
researchers ask the cyclists to ride a stationary bike at the maximum resistance at a consistent speed for as long
as they can. The time to fatigue (i.e., giving up and ceasing pedaling) is recorded (in minutes and seconds).
Three days later after some rest, the cyclists come back in for another test. This time they are given a dose of
13 mg of caffeine and asked to repeat the same stationary bike test 30 minutes later. The time to fatigue (in
minutes and second) is again recorded.
Subject
No caffeine
13 mg
1
5.05
6.20
2
4.50
4.64
3
7.25
8.47
4
6.20
7.04
5
4.47
5.55
6
5.10
5.33
7
5.17
6.35
8
6.20
7.91
9.
8.15
9.30
Expert Solution
This question has been solved!
Explore an expertly crafted, step-by-step solution for a thorough understanding of key concepts.

Step by step
Solved in 2 steps with 1 images

Knowledge Booster


Learn more about
Need a deep-dive on the concept behind this application? Look no further. Learn more about this topic, statistics and related others by exploring similar questions and additional content below.Recommended textbooks for you
Linear Algebra: A Modern Introduction
Algebra
ISBN:
9781285463247
Author:
David Poole
Publisher:
Cengage Learning

Trigonometry (MindTap Course List)
Trigonometry
ISBN:
9781337278461
Author:
Ron Larson
Publisher:
Cengage Learning
Linear Algebra: A Modern Introduction
Algebra
ISBN:
9781285463247
Author:
David Poole
Publisher:
Cengage Learning
Trigonometry (MindTap Course List)
Trigonometry
ISBN:
9781337278461
Author:
Ron Larson
Publisher:
Cengage Learning