What type of test would you use to test that M&M follows their stated distribution?

Holt Mcdougal Larson Pre-algebra: Student Edition 2012
1st Edition
ISBN:9780547587776
Author:HOLT MCDOUGAL
Publisher:HOLT MCDOUGAL
Chapter11: Data Analysis And Probability
Section: Chapter Questions
Problem 3CST

Related questions
Question
21
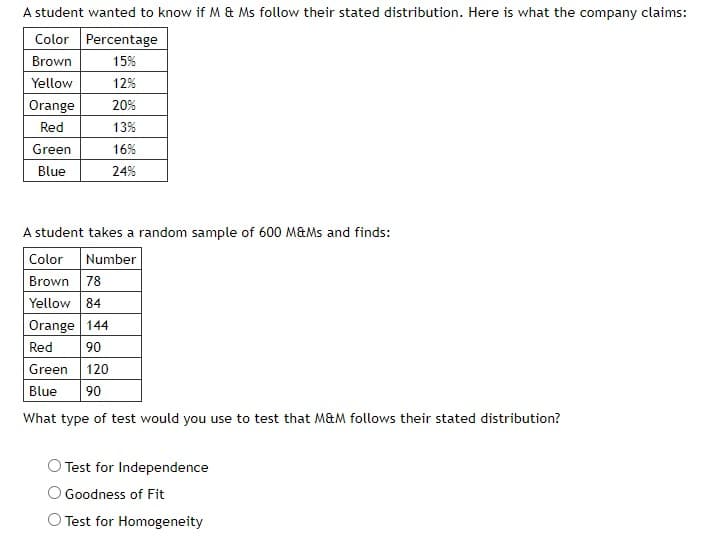
Transcribed Image Text:A student wanted to know if M & Ms follow their stated distribution. Here is what the company claims:
Color Percentage
Brown
15%
Yellow
12%
Orange
20%
Red
13%
Green
16%
Blue
24%
A student takes a random sample of 600 M&Ms and finds:
Color Number
Brown 78
Yellow 84
Orange 144
Red
90
Green 120
Blue 90
What type of test would you use to test that M&M follows their stated distribution?
Test for Independence
Goodness of Fit
O Test for Homogeneity
Expert Solution
This question has been solved!
Explore an expertly crafted, step-by-step solution for a thorough understanding of key concepts.

This is a popular solution!

Trending now
This is a popular solution!

Step by step
Solved in 2 steps

Recommended textbooks for you
Holt Mcdougal Larson Pre-algebra: Student Edition…
Algebra
ISBN:
9780547587776
Author:
HOLT MCDOUGAL
Publisher:
HOLT MCDOUGAL

Glencoe Algebra 1, Student Edition, 9780079039897…
Algebra
ISBN:
9780079039897
Author:
Carter
Publisher:
McGraw Hill
Holt Mcdougal Larson Pre-algebra: Student Edition…
Algebra
ISBN:
9780547587776
Author:
HOLT MCDOUGAL
Publisher:
HOLT MCDOUGAL
Glencoe Algebra 1, Student Edition, 9780079039897…
Algebra
ISBN:
9780079039897
Author:
Carter
Publisher:
McGraw Hill