What type of two-sample hypothesis test should you use? Step 2. Select the Level of Significance, a A 5 percent significance level is selected. Step 3. State the Null Hypothesis (H,) and Alternate Hypothesis (H,) H,: Step 4. Compose the Decision Rule
What type of two-sample hypothesis test should you use? Step 2. Select the Level of Significance, a A 5 percent significance level is selected. Step 3. State the Null Hypothesis (H,) and Alternate Hypothesis (H,) H,: Step 4. Compose the Decision Rule

Holt Mcdougal Larson Pre-algebra: Student Edition 2012
1st Edition
ISBN:9780547587776
Author:HOLT MCDOUGAL
Publisher:HOLT MCDOUGAL
Chapter11: Data Analysis And Probability
Section: Chapter Questions
Problem 8CR

Related questions

Question
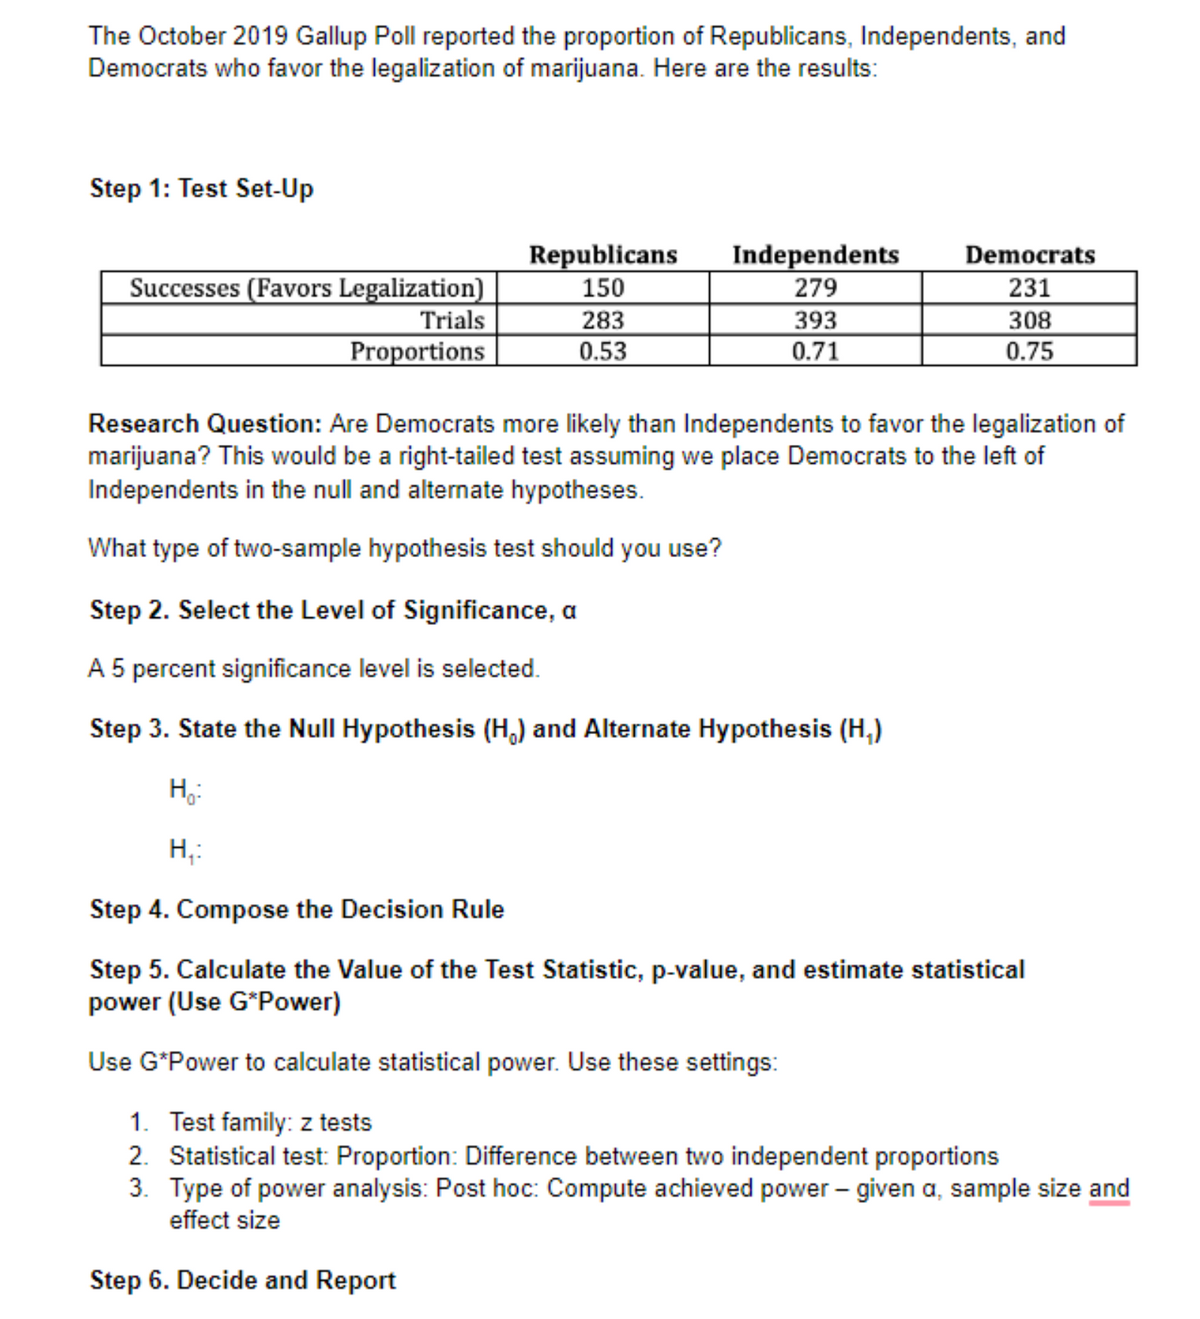
Transcribed Image Text:The October 2019 Gallup Poll reported the proportion of Republicans, Independents, and
Democrats who favor the legalization of marijuana. Here are the results:
Step 1: Test Set-Up
Republicans
150
Independents
279
Democrats
Successes (Favors Legalization)
Trials
Proportions
231
283
393
0.71
308
0.75
0.53
Research Question: Are Democrats more likely than Independents to favor the legalization of
marijuana? This would be a right-tailed test assuming we place Democrats to the left of
Independents in the null and alternate hypotheses.
What type of two-sample hypothesis test should you use?
Step 2. Select the Level of Significance, a
A 5 percent significance level is selected.
Step 3. State the Null Hypothesis (H,) and Alternate Hypothesis (H,)
H,:
Step 4. Compose the Decision Rule
Step 5. Calculate the Value of the Test Statistic, p-value, and estimate statistical
power (Use G*Power)
Use G*Power to calculate statistical power. Use these settings:
1. Test family: z tests
2. Statistical test: Proportion: Difference between two independent proportions
3. Type of power analysis: Post hoc: Compute achieved power – given a, sample size and
effect size
Step 6. Decide and Report
Expert Solution
This question has been solved!
Explore an expertly crafted, step-by-step solution for a thorough understanding of key concepts.

This is a popular solution!

Trending now
This is a popular solution!

Step by step
Solved in 2 steps with 1 images

Knowledge Booster


Learn more about
Need a deep-dive on the concept behind this application? Look no further. Learn more about this topic, statistics and related others by exploring similar questions and additional content below.Recommended textbooks for you
Holt Mcdougal Larson Pre-algebra: Student Edition…
Algebra
ISBN:
9780547587776
Author:
HOLT MCDOUGAL
Publisher:
HOLT MCDOUGAL

College Algebra (MindTap Course List)
Algebra
ISBN:
9781305652231
Author:
R. David Gustafson, Jeff Hughes
Publisher:
Cengage Learning
Holt Mcdougal Larson Pre-algebra: Student Edition…
Algebra
ISBN:
9780547587776
Author:
HOLT MCDOUGAL
Publisher:
HOLT MCDOUGAL
College Algebra (MindTap Course List)
Algebra
ISBN:
9781305652231
Author:
R. David Gustafson, Jeff Hughes
Publisher:
Cengage Learning